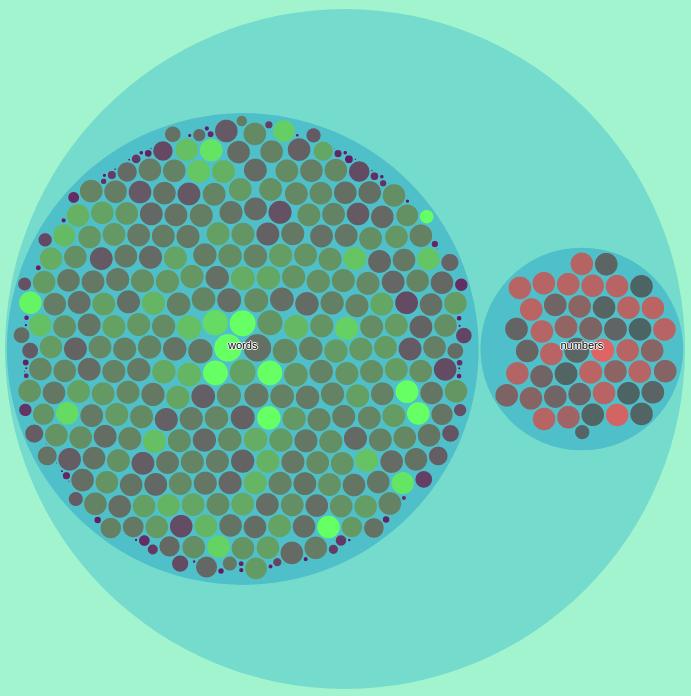
A tiny python library for visualizing hierarchical clusters using packed circle visualization
You can install this package directly from github using the following command:
pip3 install git+https://github.com/m30m/cluster_pack.gitThe input should have a structure like the one below:
{
  "name": "root",
  "children": [
    {
      "size": 4,
      "name": "cluster1"
    },
    {
      "name": "cluster2",
      "children": [
        {
          "size": 3,
          "name": "subcluster1"
        },
        {
          "size": 1,
          "name": "subcluster2"
        }
      ]
    }
  ]
}
Each node can have the following attributes:
{
  "name": "root", # name shown on the plot
  "children": [...], # array of nodes
  "size": 4, # size of the cluster
  "color": "red", # can be anything
  "info": "any extra information", # this will be shown in the info box next to the plot, it can be arbitrary html
  "image": "file://path/to/some/image.jpg" # background of the circle in clustering, useful for image clustering
}
Nodes should either have the children attribute or size attribute if they are leaf nodes.
If you are using jupyter notebook:
from cluster_pack import visualize_notebook

visualize_notebook(clusters, size=900) # size parameter is the width and height of output svg
If you want the raw html:
from cluster_pack import visualize

html = visualize(clusters, size=900)

with open('output.html','w') as output_file:
    output_file.write(html)