flipr hackathon challenge
-
./data/
- It has the dataset files (I should have ignored it (by mentioning it in .gitignore)
-
./src/
- two notebooks corresponding to each task
-
./predictions/
- three .csv files containing predicted values for Infect_prob, Diuresis value on 27-03-2020 predicted by the time series model and Infect_prob on new Diuresis value(predicted by the Time series model)
-
./assets/
- containing figures plotted in the task
Coronavirus disease 2019 (COVID- 19 ) is an infectious disease caused by severe acute
respiratory syndrome coronavirus 2 (SARS-CoV-2). The disease was first identified in
2019 in Wuhan, China, and has since spread globally, resulting in the 2019 – 20
coronavirus pandemic. Epidemiologists are teaming up with data scientists to stem the
spread of the novel coronavirus by tapping big data, machine learning and other digital
tools. The goal is to get real-time forecasts and other critical information to front-line
health-care workers and public policy makers as the outbreak unfolds. The objective of
the Hackathon is to predict the probability of person getting infected by Covid-19.
Coronaviruses are a family of hundreds of viruses that can cause fever, respiratory problems, and sometimes gastrointestinal symptoms too. The 2019 novel coronavirus is one of seven members of this family known to infect humans, and the third in the past three decades to jump from animals to humans. Since emerging in China in December, this new coronavirus has caused a global health emergency, sickening almost 200,000 people worldwide, and so far killing more than 9,000. As of March 19, about 10000 cases had been reported in the US, and 155 people have died.
In Wuhan, home to 11 million people, the initial number of cases was 40,
estimated by a group of researchers led by Natsuko Imai of Imperial College. The number of exposed was assumed to be 20 times this number. The basic
reproduction number (BRN) is the expected number of cases directly generated by one case. A BRN greater than one indicates that the outbreak is self-sustaining,
while a BRN less than one indicates that the number of new cases decreases over time and eventually the outbreak will stop. Ideally, the BRN should be reduced in
order to slow down an epidemic. The BRN in the first three phases was estimated to be 3.1, 2.6, and 1.9, respectively. In the Cell Discovery article, the BRN is assumed to have decreased to 0.9 or 0.5 in phase IV, based on previous
experience in SARS. According to an article in Science in 2003, the BRN of SARS decreased from 2.7 to 0.25 after the patients were isolated and the infection
started being controlled.
The better we can track the virus, the better we can fight it. By analyzing different parameters responsible for the outbreak of coronavirus, we can take controlling measures in an accelerated way.
India has 197 Total cases, out of which there are 4 deaths reported and 173 of those cases are still active. With a hope of controlling the epidemic, this machine learning problem is designed to cater the need of a prediction model that can predict the probability of a person getting infected by covid- 19.
The whole world is participating in a fight against this pandemic. The healthcare data science community can have a big impact on combating this disease. There have been many excellent efforts to use data visualization and monte carlo simulations to help combat the spread of this pandemic. The expected prediction model would address a complimentary and important aspect of health policy, identifying those most at risk. By combining the efforts of these and many other excellent efforts in the healthcare technology space, we hope to mitigate the effects of this terrible disease.
Part -01 :
The objective of the first part of the problem statement is to predict the probability of a person getting infected by Covid- 19 on 20th March 2020. The output file 01 should contain only people_ID and the respective infect_prob for the test data.
Part -02 :
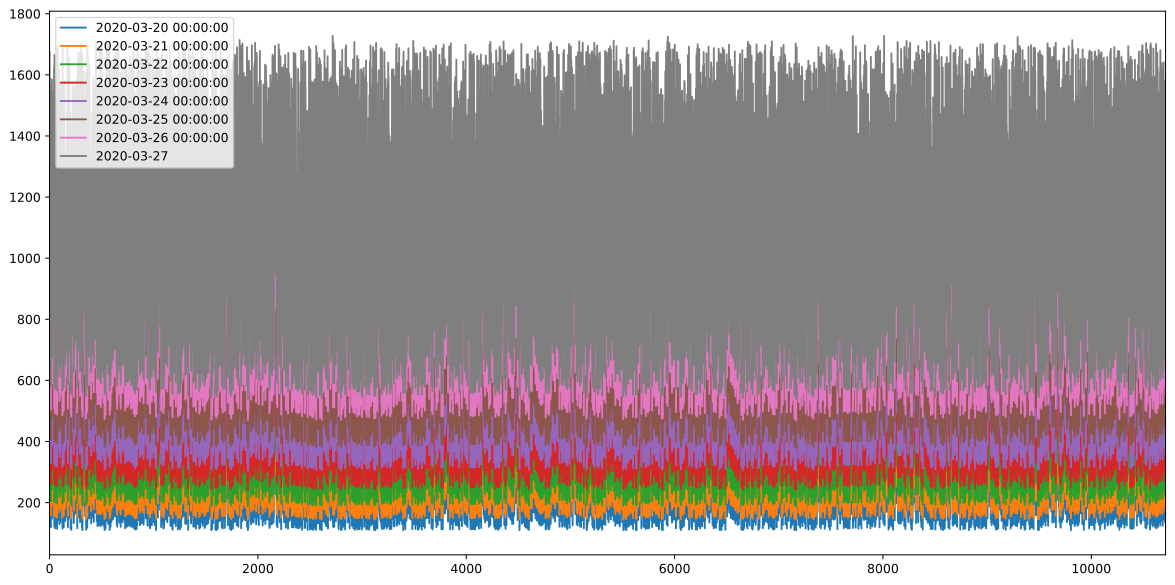
The Diuresis of a person is a time-dependent parameter, for which you have to come up with a Time-series prediction model. Using the Diuresis predicted by the model, you need to calculate the infect_prob on 27th March 2020 for every people_ID in the test data.. The output file 02 should contain only people_ID and the respective infect_prob on 27th March.
There are 3 files provided:
1. Variable_Description.xlsx : This file contains description of all the variables available in the dataset 2. Training_data.xlsx : This is the training dataset on which model has to be trained, which contains parameters of a person on 20th March 2020 3. Test_data.xlsx : This is the test data on which accuracy of the model will be computed
There should only be one submission per participant
Privately sharing of code is not permitted. In case of plagiarism, the participant shall be disqualified Those attempting both the parts should send 2 separate .csv/.xlsx file, containing people_ID and infect_prob on 20th March and 27th March respectively
The solution_sheet should also be attached along with the results Share all your files in this Google form link: https://docs.google.com/forms/d/18SkI7vbSc- dHdlnjLMtYsbZZ4kN_vk5XIFxGEyp2QDc/viewform?edit_requested=true
