A plugin to create breakdowns of netflow traffic based on source/destination IPs, interfaces and ASNs.
This project was written to be used by a national ISP in order to process netflow data from border routers and help with traffic balancing and generate reports with traffic per ASN. It was written between 2007-2009 with tweaks throughout the years. It is currently no longer in use (replaced with Arbor/Netscout SP) so this is why it's being released to the general public. Sadly, large chunks of the code have poor quality - especially the web interface (sorry, I was young and inexperienced), and also it wasn't designed to be generic, so things are hardcoded and may need tweaking for you. Sadly, due to lack of time, I can't support and extend it anymore, but the web interface should be rewritten from scratch. Also, it could move away from storing data in rrd files, and could be (easily) extended to write data to a database (influxdb for instance) and present it in modern visualisation tools like Grafana.
Here are some screenshots to give you an idea what the web interface can show:
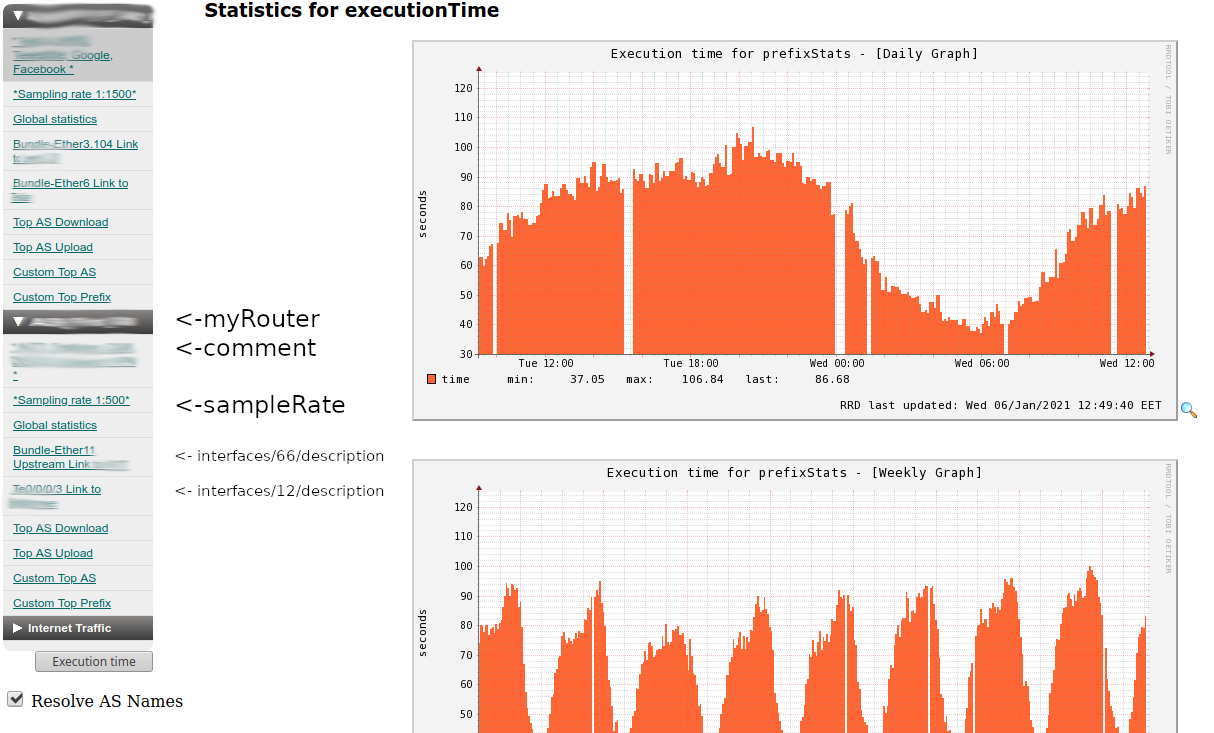 Clicking the
 Execution time button will show you how long the backend plugin takes to go through and extract the data. It's best if it finishes before 5 minutes. If it exceeds 10 minutes you may run into avalanche effect (having past instances still running).
The arrows in the picture point to the menu, showing entries for each Router, its comment, sample rate and list of interfaces (extracted from plugin configuration)
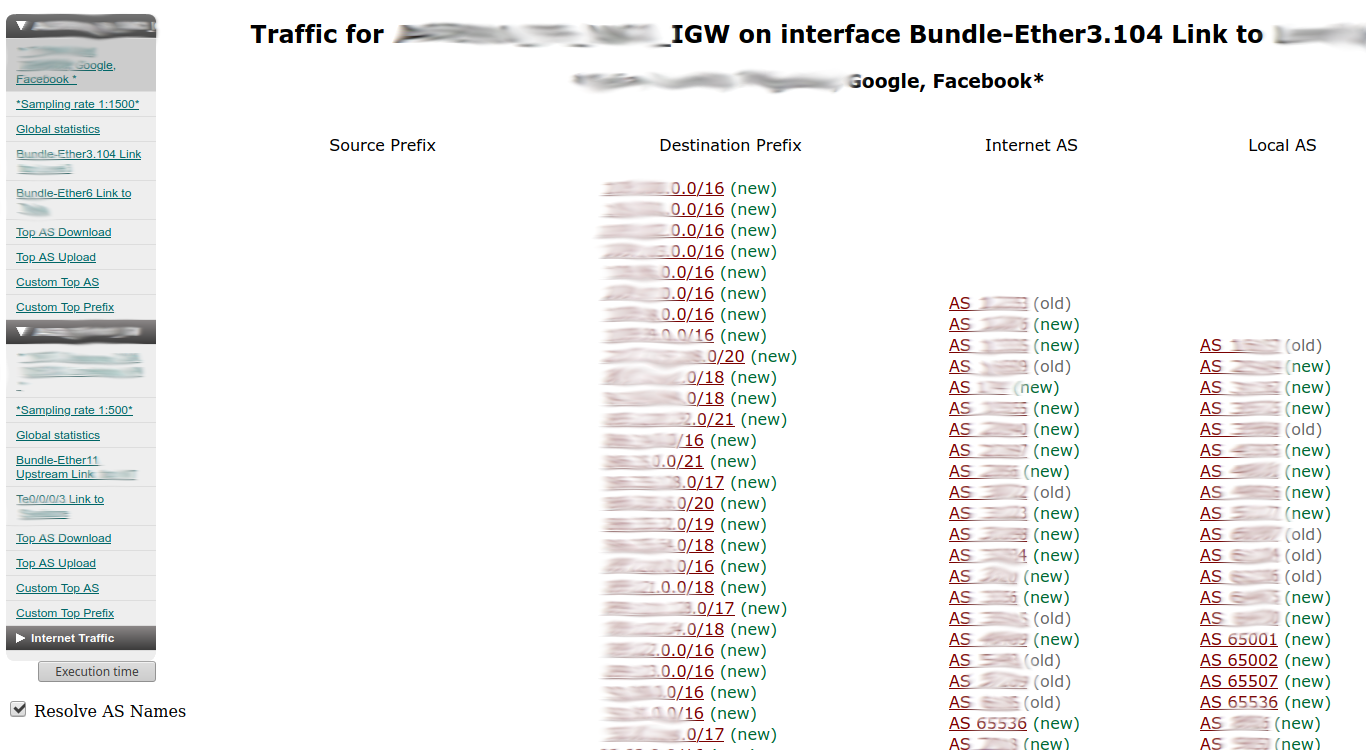 Clicking on an interface from a router will display a table with a column of source prefixes (if configured), destination prefixes (if configured), Internet AS and Local AS (if tops are enabled). The new and old labels show you which entries have been updated in the past 5 minutes.
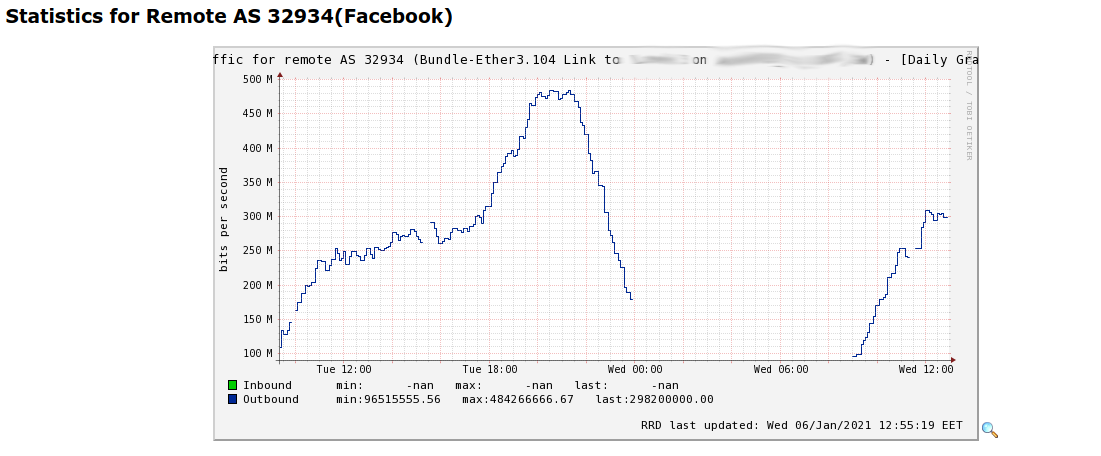 Hovering the mouse over an AS number will give you its name (via whois), and clicking on it will show you traffic of that AS that passed through the interface. The holes/gaps you see in the graph are caused by the fact that during that time period the AS was no longer in top 10 for that interface and data was not collected. This is normal behavior.
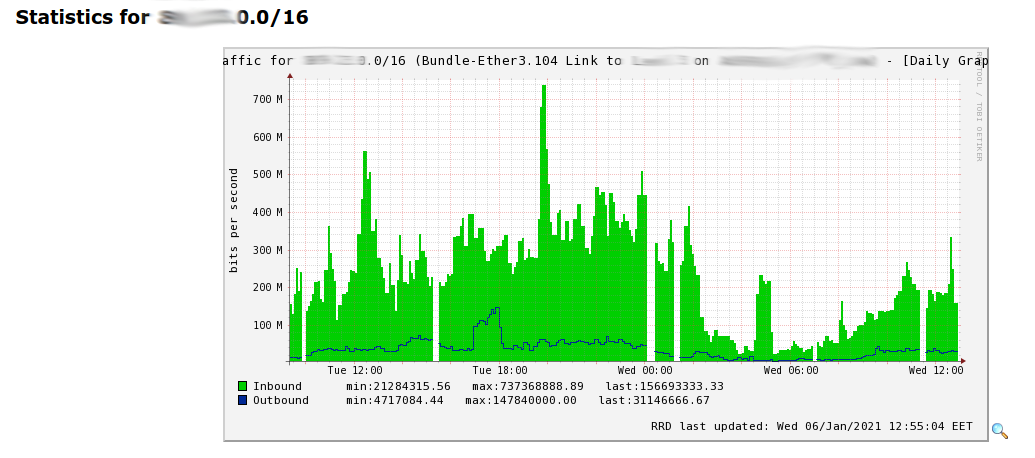 Clicking on a prefix will show you its traffic based on netflow data that passed on that specific interface. Useful for knowing how to balance traffic in case of upstream congestion.
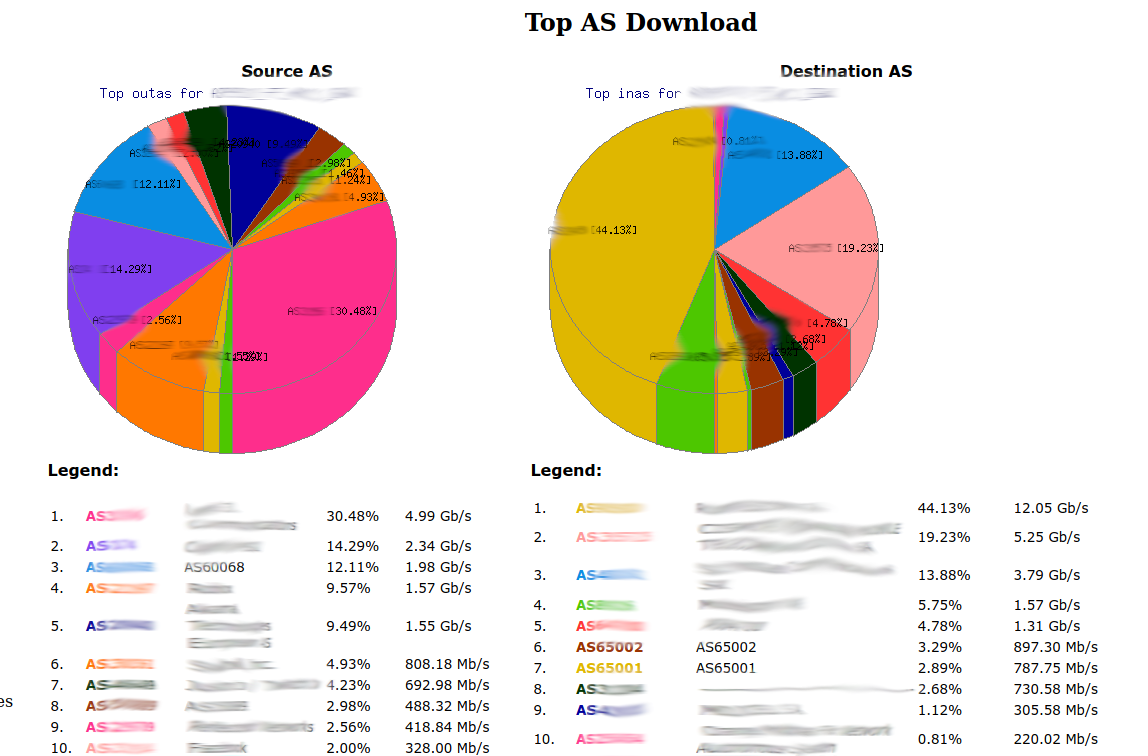 Generates a pie chart with the traffic distribution per AS number based on the last 5 minutes of traffic. AS65536 has a special meaning and means "Traffic that goes to other ASes that didn't make it in the top".
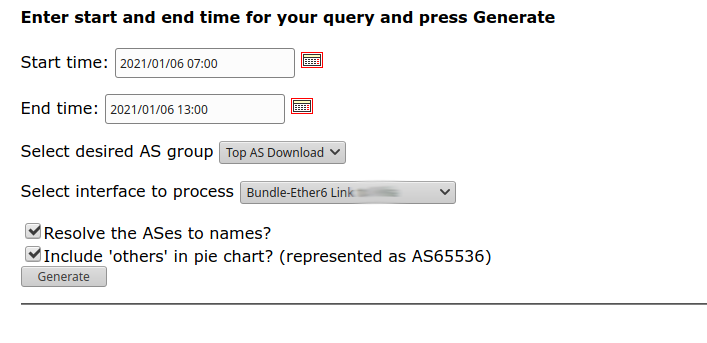
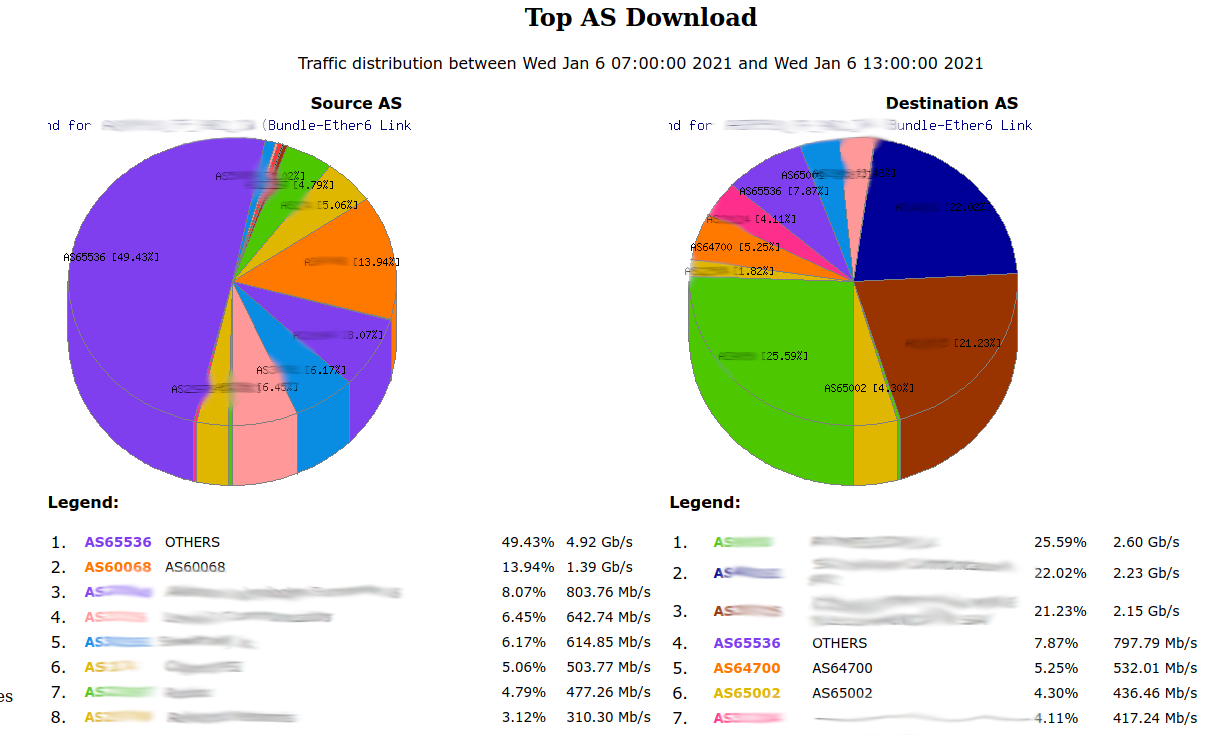 You can also generate the report based on a time interval and specific interface.
The backend plugin (prefixStats.pm) is called by nfsen every 5 minutes for each configured profile (e.g. live). It loops through the configured routers and the configured interfaces for each router and runs nfdump queries to extract the data needed (e.g. traffic for each prefix for each interface for each router, top 10 src/dst as, etc). The data is written to rrd files in $rrdDir in the following structure:
- global traffic (sum of all interface traffic) for prefix
1.2.3.0/24for routerrouter1:router1/1.2.3.0_24.rrd - global traffic from AS1234 for router
router1:router1/inas1234.rrd - global traffic to AS1234 for router
router1:router1/outas1234.rrd - traffic for prefix
1.2.3.0/24for routerrouter1on interface with ifindex112:router1/112/1.2.3.0_24.rrd - traffic from AS1234 for router
router1on interface with ifindex112:router1/112/inas1234.rrd - traffic to AS1234 for router
router1on interface with ifindex112:router1/112/outas1234.rrd
The web interface uses the configuration to build the menu (dynamically) and uses file globbing to categorize the data and render the graphs.
Note that the code is tested with 10 year old packages (runs on CentOS6). Most likely it will need some tweaks to run on more modern perls and with more modern plugins. Let me know what errors you run into. It was tested with nfsen 1.3.6p1.
- whois
- dig
- CGI
- GD::Graph::pie
- RRDs
- RRD::Simple
- RRDTool::OO
- Log::Log4perl
- Log::Log4perl::Appender
- Log::Log4perl::Layout::PatternLayout
- Sys::Syslog
Unfortunately throughout the code there are some assumptions and hardcoded paths that need to be present:
- nfsen is installed in /data/nfsen (ideally create it as a symlink to your actual nfsen installation) (PRs are welcome)
- nfsen data is using the flat SUBDIRLAYOUT (
$SUBDIRLAYOUT = 0). No other layouts are supported (PRs are welcome) - the web interface (contents of
frontend) lives in/var/www/html/statistics(configurable)
- install prerequisites (see above)
- copy
backend/prefixStats.pmandbackend/prefixStatsConfig.pmto yourpluginsdirectory (e.g./data/nfsen/plugins) - copy
configuration/prefixStats.default.confto your nfsenetcdirectory (e.g./data/nfsen/etc) and rename it toprefixStats.conf - take the time to read through the
prefixStats.conffile. It will teach you how to configure your graphs. - copy the files from
frontend/to/var/www/html/statistics(or wherever your web server will find them). - configure your web server to serve CGI from
/var/www/html/statistics(example for apache):
#
# Cause the Perl interpreter to handle files with a .pl extension.
#
AddHandler cgi-script .cgi .pl

#
# Add index.php to the list of files that will be served as directory
# indexes.
#
DirectoryIndex index.pl

<Directory "/var/www/html/statistics">
    Options Indexes FollowSymLinks ExecCGI
    Order allow,deny
    Allow from all
#    AllowOverride AuthConfig
</Directory>
- give the correct rights for your pics, rrds folders:
chown -R netflow:apache /var/www/html/statistics/pics
chown -R netflow:apache /var/www/html/statistics/rrds
chown -R netflow:apache /var/www/html/statistics/temporary_pictures
chmod g+w /var/www/html/statistics/pics /var/www/html/statistics/rrds /var/www/html/statistics/temporary_pictures
- Restart your web server and see if the web interface loads
- Enable the plugin in your nfsen config (
/data/nfsen/etc/nfsen.conf):
@plugins = (
    # profile    # module
    [ 'live', 'prefixStats' ],
);
Please thoroughly read this configuration template: https://github.com/mad-ady/nfsen-prefixStats/blob/main/configuration/prefixStats.default.conf
The plugin logs to /var/log/prefixStats.log, and is quite noisy. Add an entry to do log rotation:
# cat /etc/logrotate.d/prefixstats.log
/var/log/prefixStats.log {
    daily
    create 0666 root root
    rotate 7
    postrotate
    /data/nfsen/bin/nfsen reload
    endscript
}
Good luck!