This project involves developing an ETL pipeline integrated with supervised learning and grid search to classify text messages sent during disaster events.
It includes an ML pipeline and a web app designed to categorize disaster response messages in real time using Natural Language Processing (NLP) techniques.
In this project, I'll apply data engineering skills to analyze disaster data from Appen to build a model for an API that classifies disaster messages.
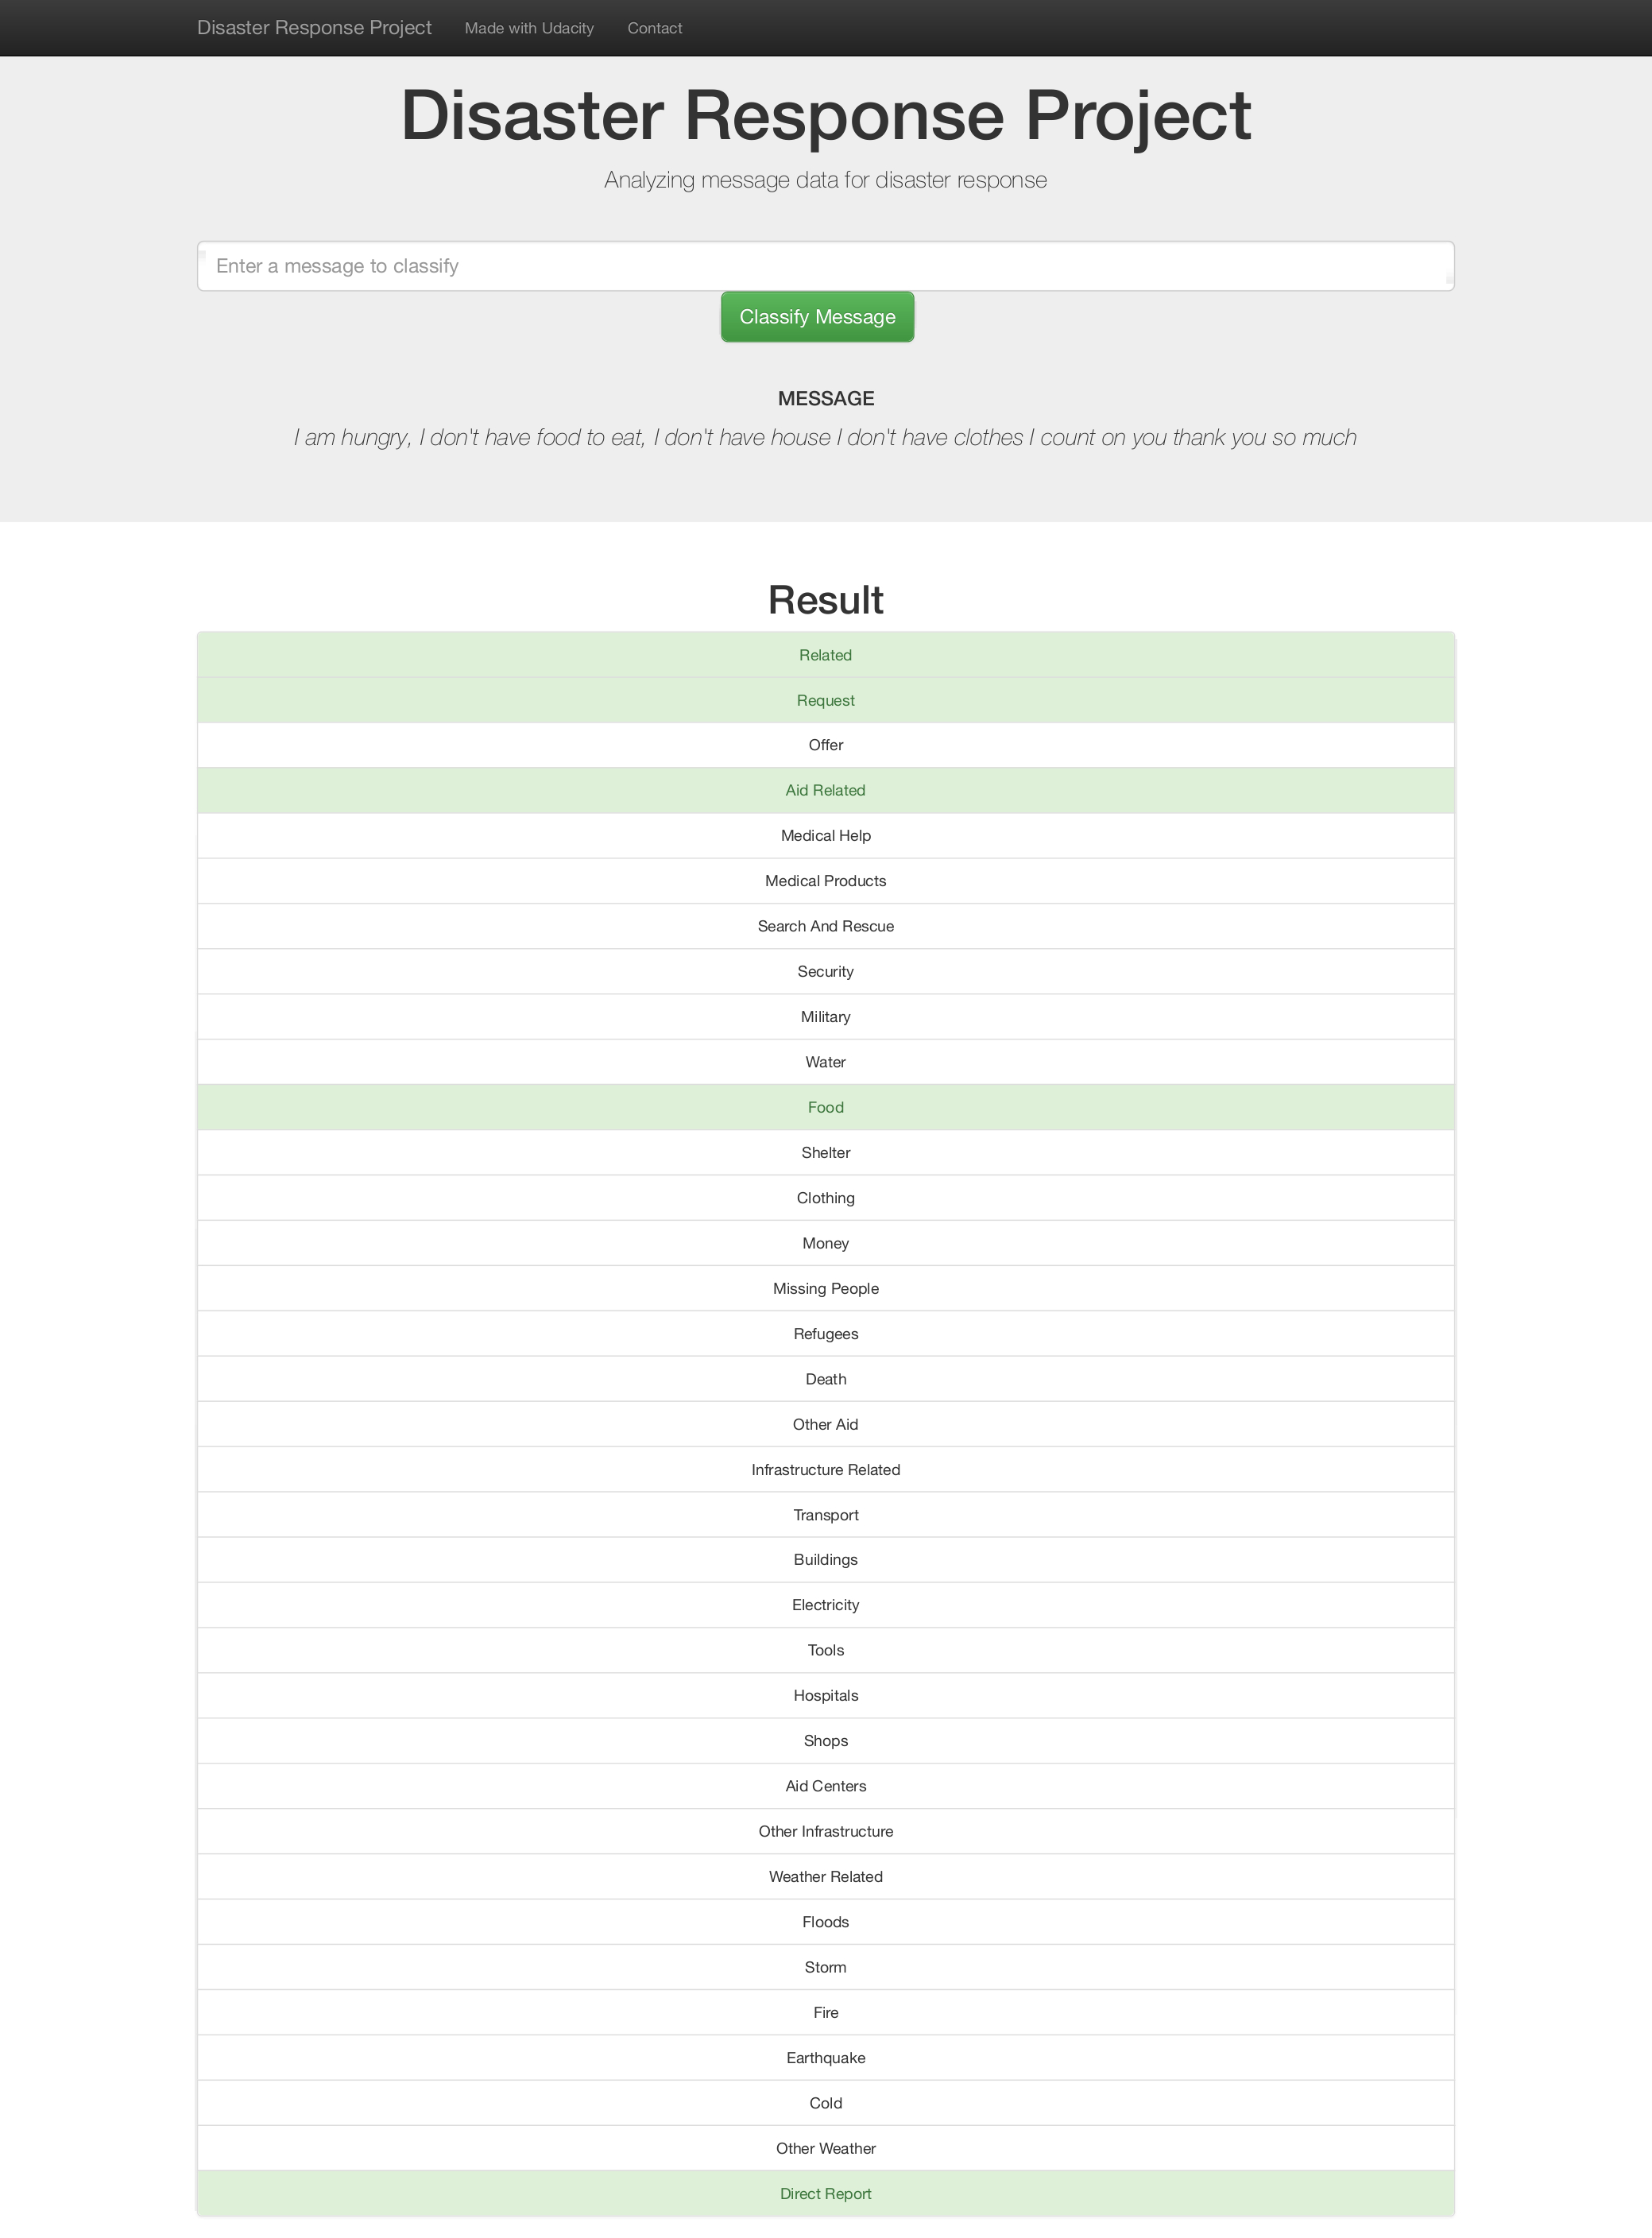
| home page | results page |
|---|---|
 |
 |
(base)$: git clone git@github.com:mafda/disaster_response_project.git
(base)$: cd disaster_response_project-
Create the conda environment
(base)$: conda env create -f environment.yml
-
Activate the environment
(base)$: conda activate disaster_response
-
Download the dataset and model from this link, create
datafolder and copy thecategories.csvandmessages.csvdatasets here.(disaster_response)$: mkdir data
.
├── README.md
├── app
│   ├── run.py
│   └── templates
│       ├── go.html
│       └── master.html
├── data
│   ├── DisasterResponse.db
│   ├── categories.csv
│   └── messages.csv
├── environment.yml
├── models
│   └── classifier_model.pkl
├── notebooks
│   ├── ETL_Pipeline_Preparation.ipynb
│   └── ML_Pipeline_Preparation.ipynb
└── src
    ├── process_data.py
└── train_classifier.py1. ETL Pipeline
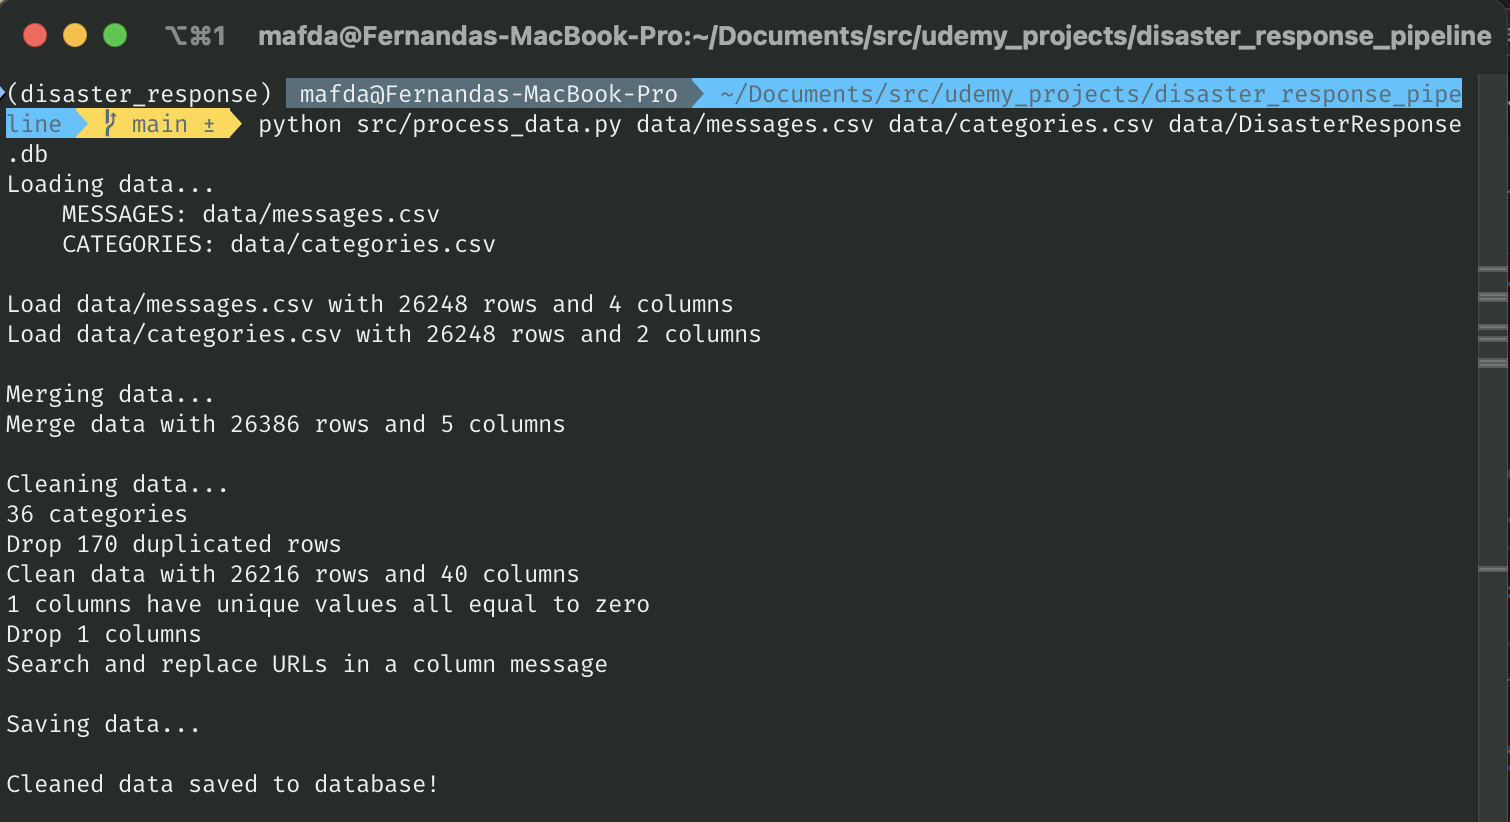
The first part of the data pipeline is the Extract, Transform, and Load process. I will read the dataset, clean the data, and then store it in a SQLite database.
File src/process_data.py, contains a data cleaning pipeline that:
- Loads the
messages.csvandcategoriescsvdatasets - Merges the two datasets
- Cleans the data
- Stores it in a SQLite database
2. ML Pipeline
The second part, I will create a machine learning pipeline that uses NLTK, as
well as scikit-learn's Pipeline and GridSearchCV to output a final model that
uses the message column to predict classifications for 36 categories
(multi-output classification). Finally, I will export your model to a pickle
file.
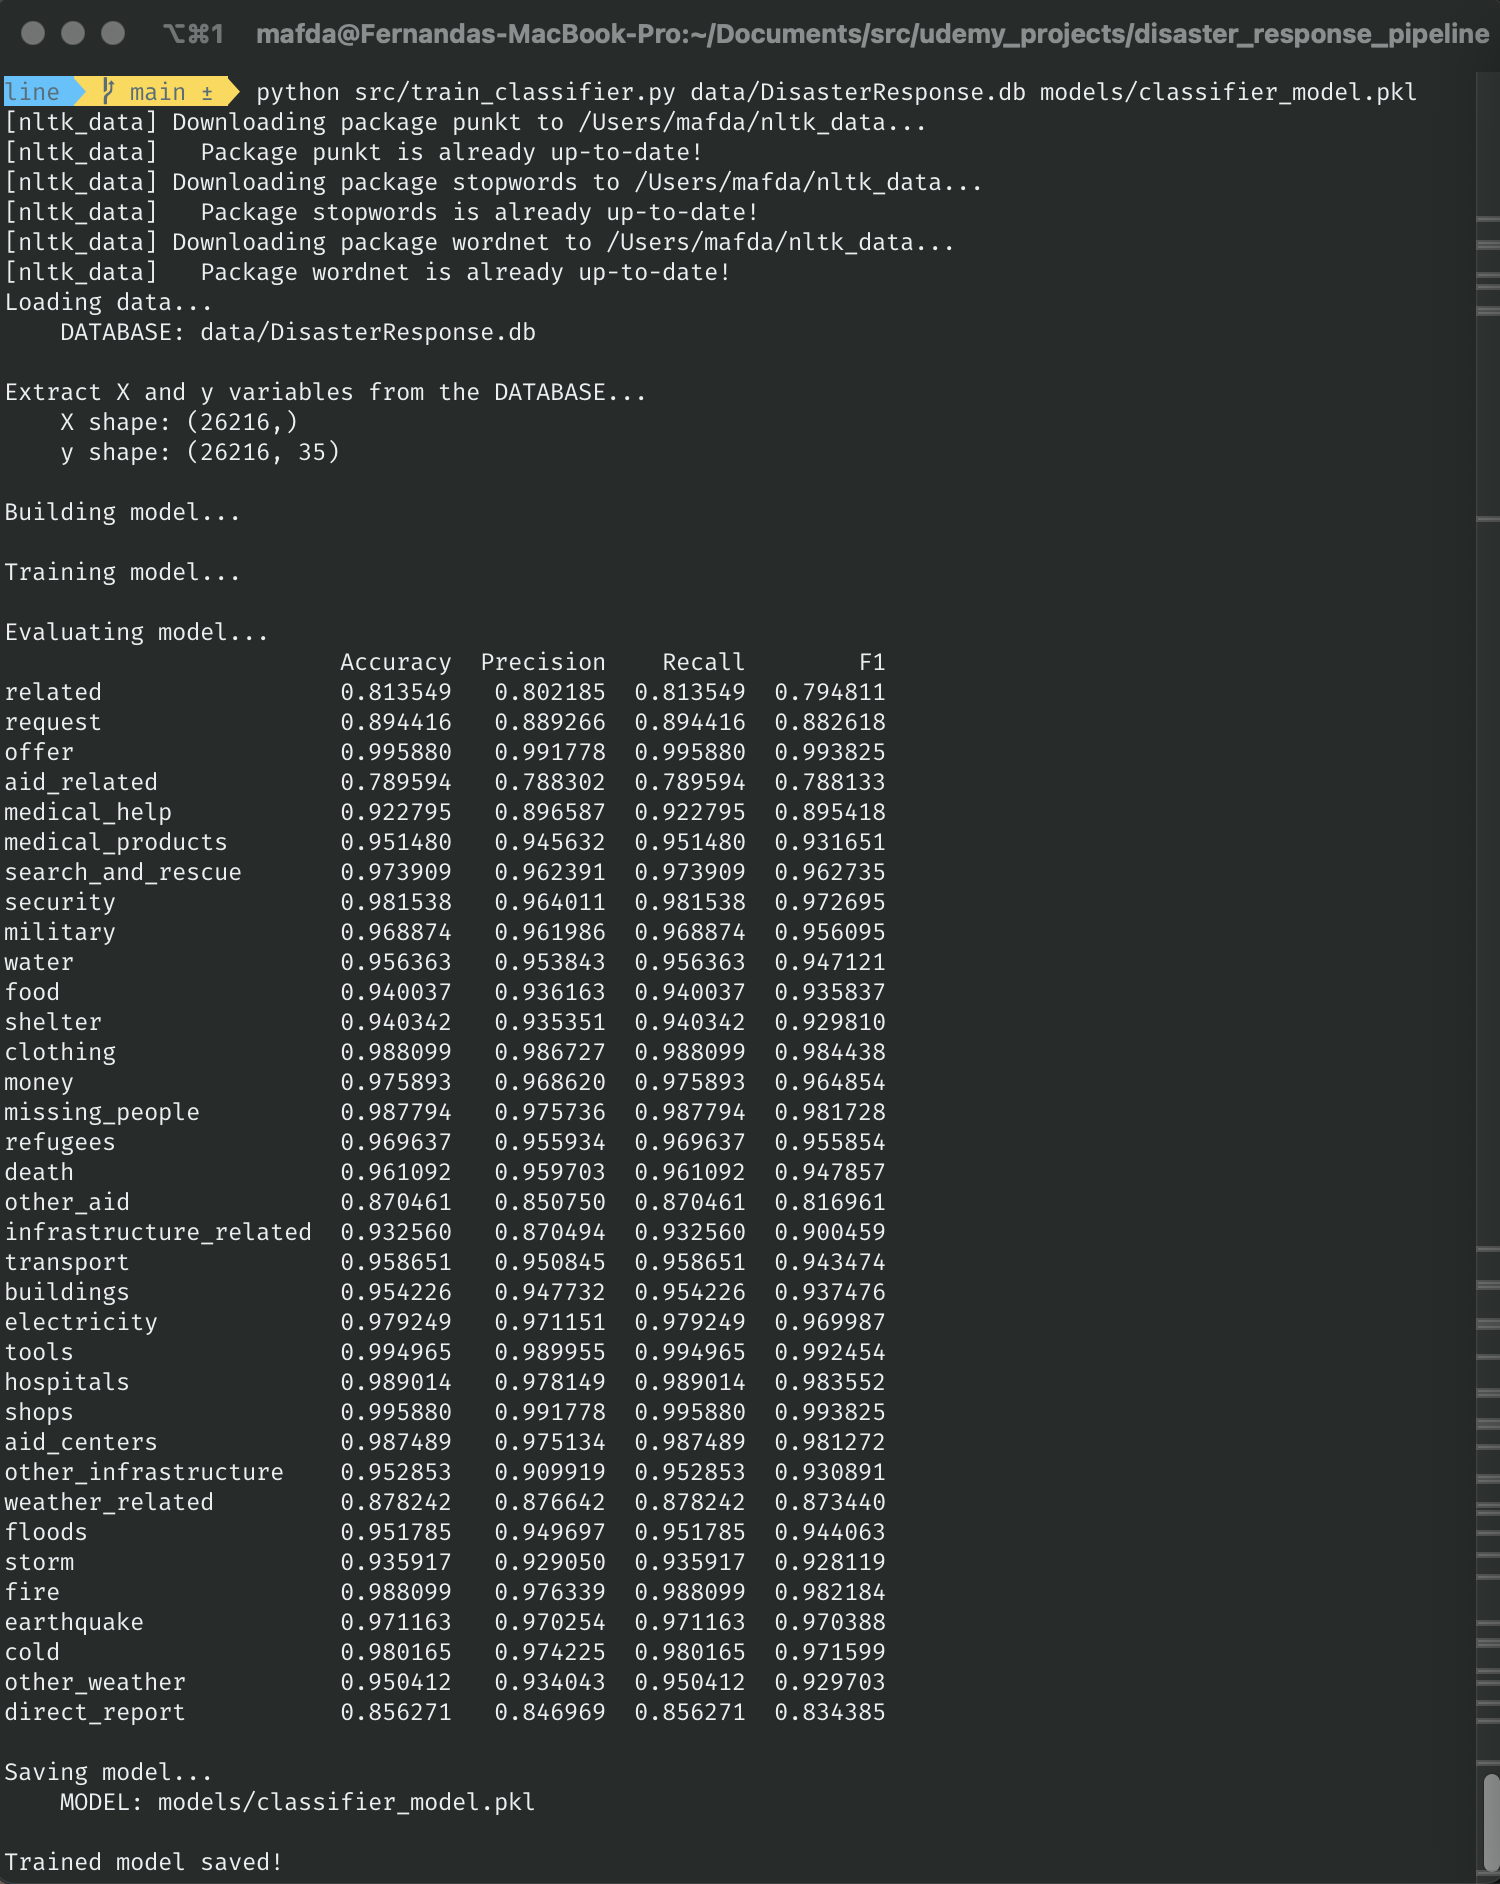
File src/train_classifier.py, contains a machine learning pipeline that:
- Loads data from the SQLite database
- Splits the dataset into training and test sets
- Builds a text processing and machine learning pipeline
- Trains and tunes a model using GridSearchCV
- Outputs results on the test set
- Exports the final model as a pickle file
3. Flask Web App
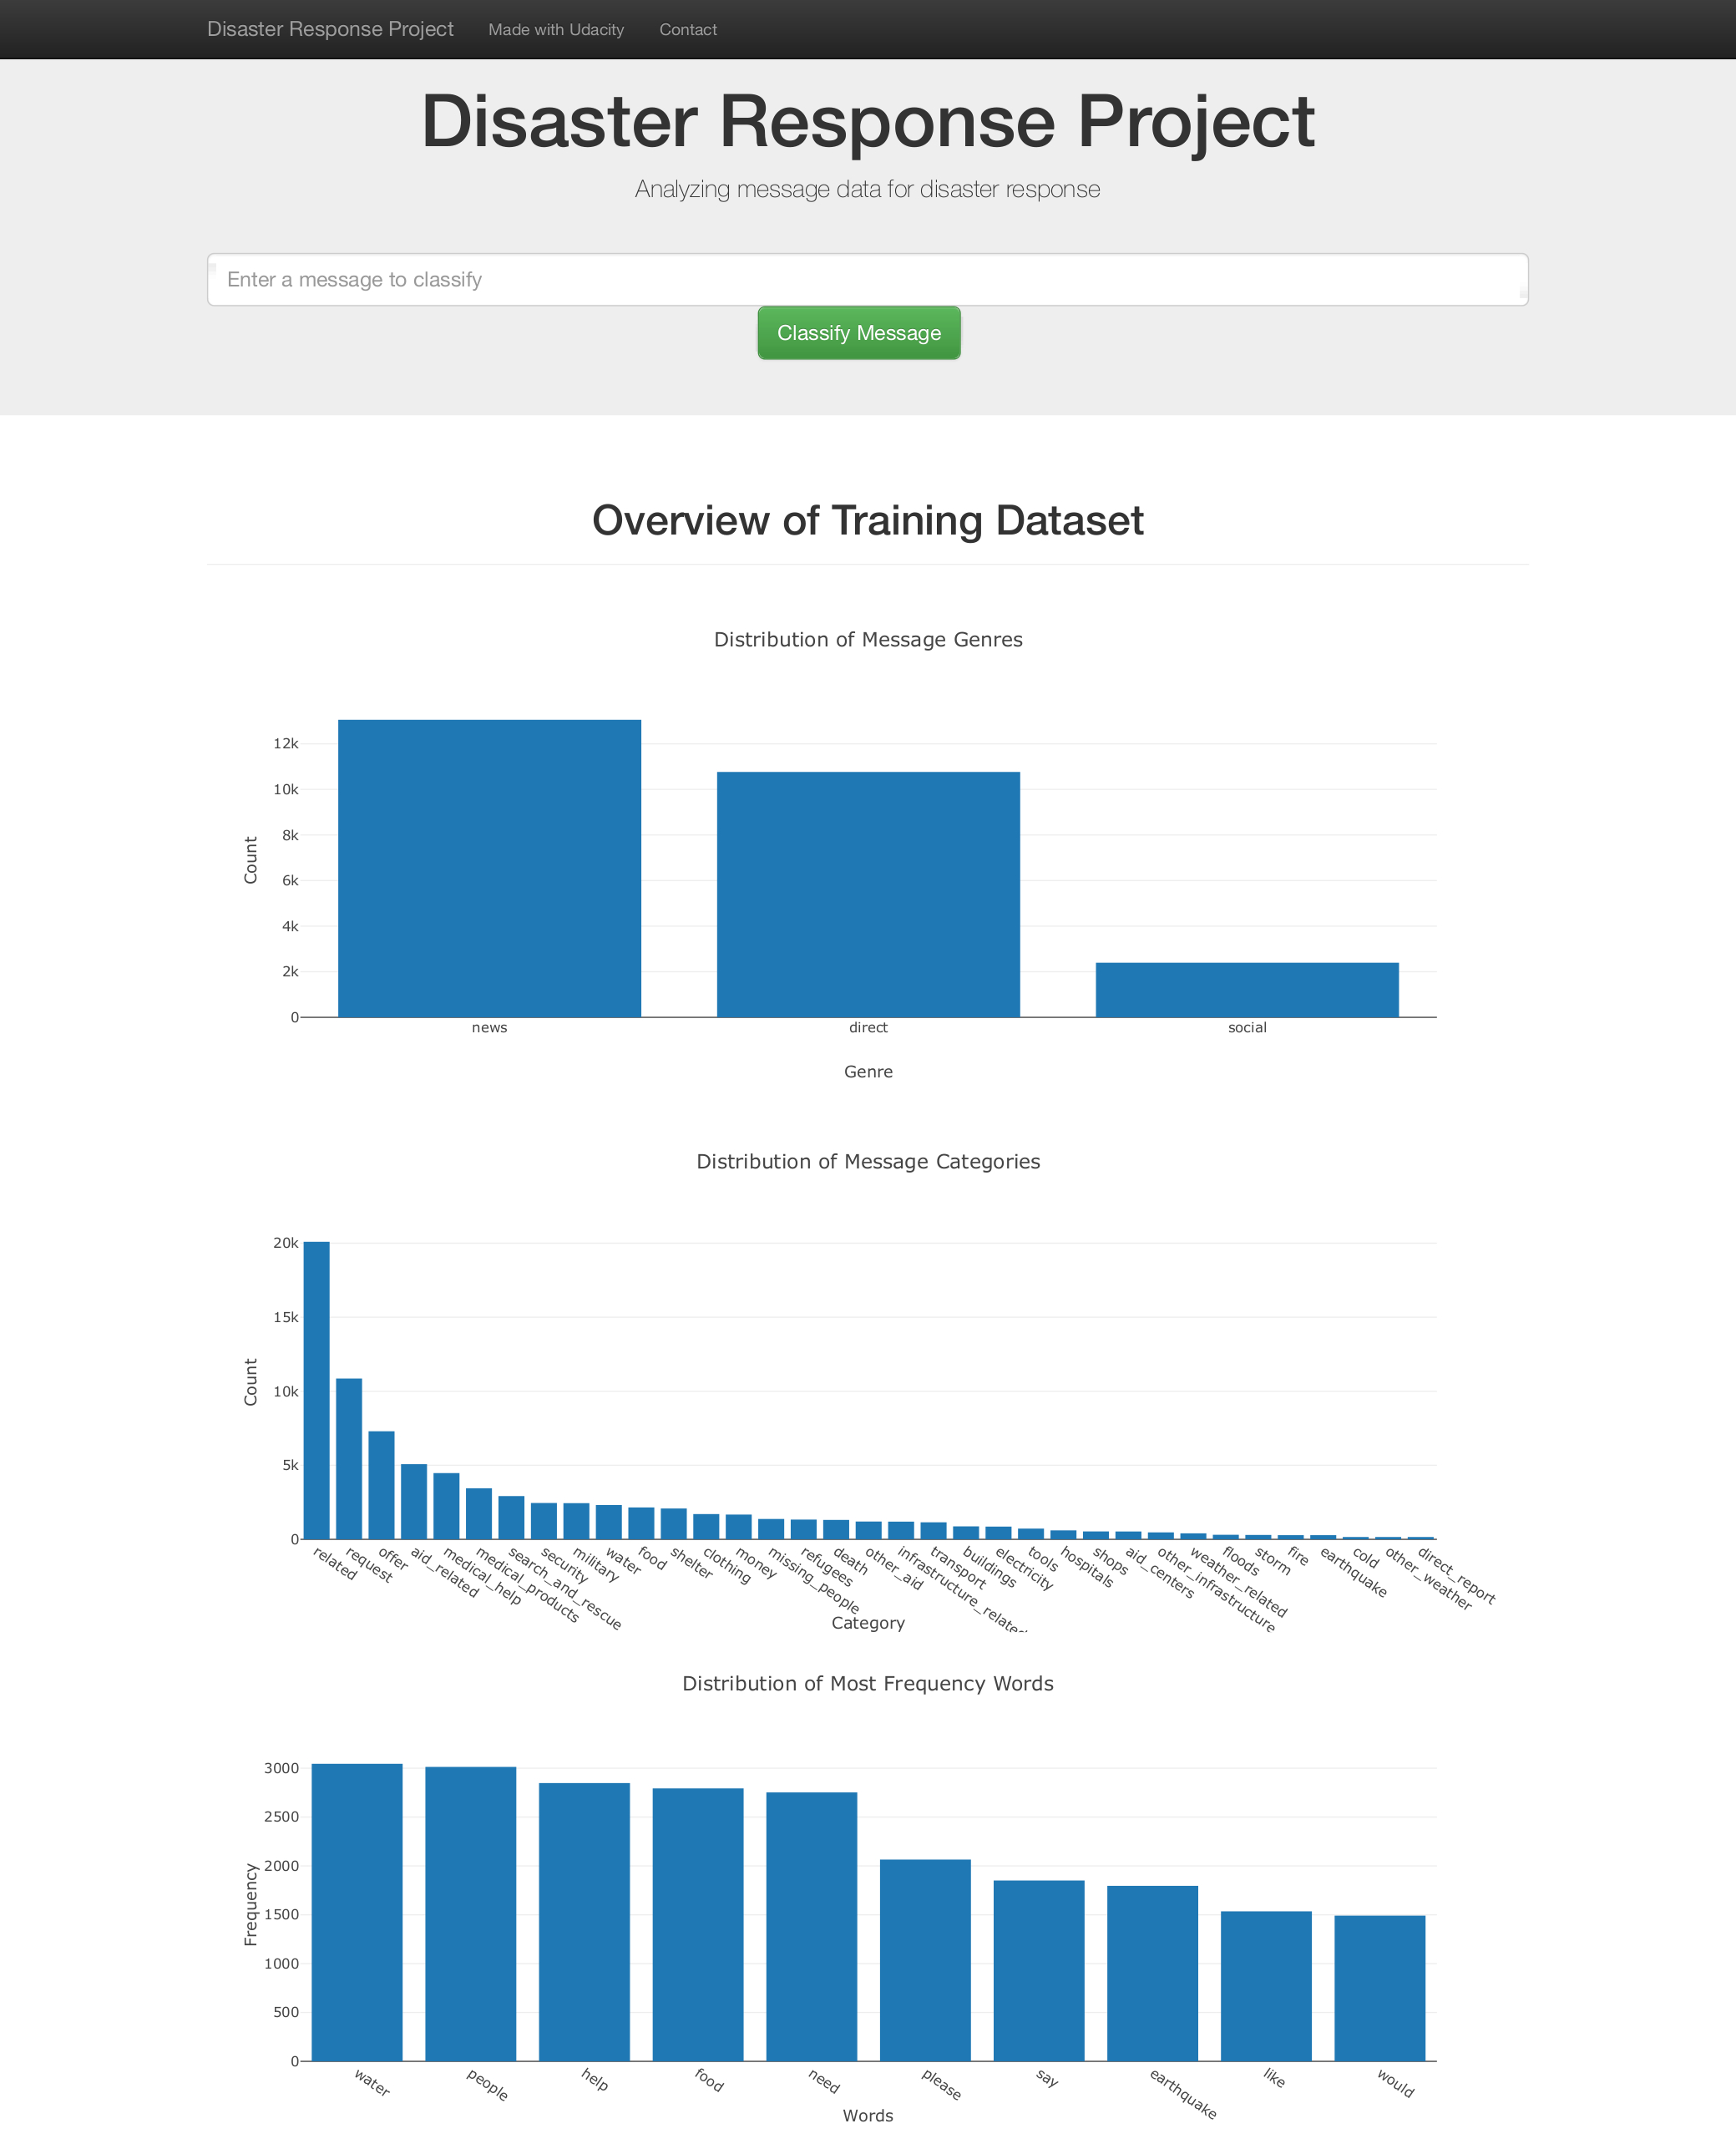
In the last step, I'll display your results in a Flask web app.
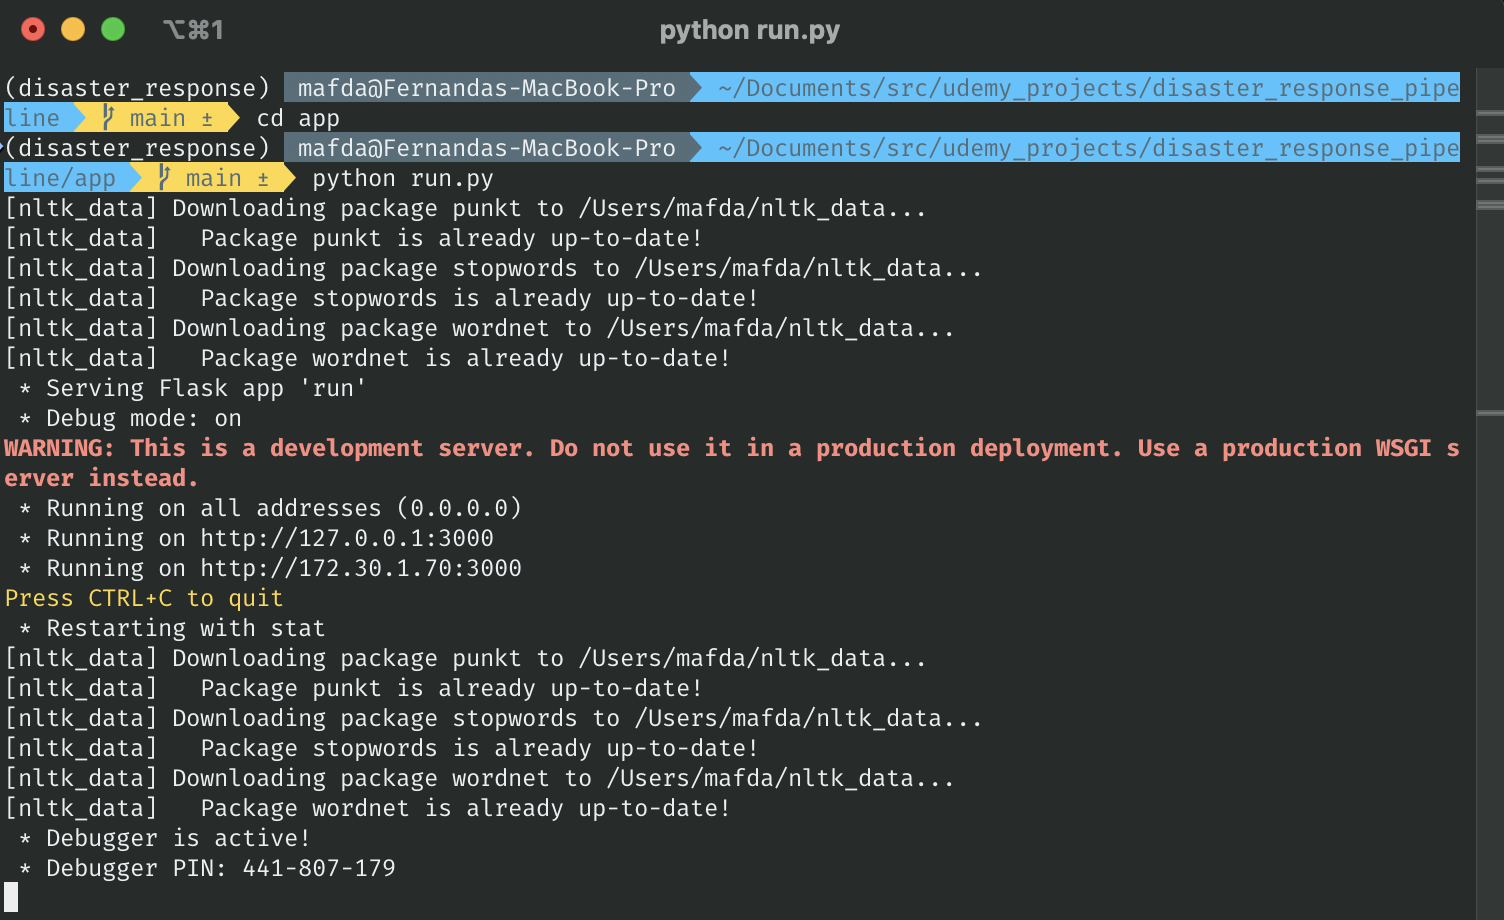
File app/run.py will start the web app where users can enter their query and
the machine learning model will categorize this event.
- Show data visualizations using Plotly in the web app.
There are 3 steps to follow, from cleaning the data, through training the model, and ending with the web app.
In the project directory, run:
(disaster_response)$: python src/process_data.py data/messages.csv data/categories.csv data/DisasterResponse.dbAfter the data cleaning process, in the project directory, run:
(disaster_response)$: python src/train_classifier.py data/DisasterResponse.db models/classifier_model.pklGo the app directory and run:
(disaster_response)$: cd app
(disaster_response) app $: python run.py
And go to http://localhost:3000
- Model 0: Basic Pipeline: This model sets up a basic text classification pipeline using Random Forest for multi-output classification.
- Model 1: Grid Search with Hyperparameter Tuning: This model aims to improve performance by tuning hyperparameters through cross-validation.
- Model 2: Feature Union Pipeline: Purpose: This model allows for more complex feature engineering by using FeatureUnion to potentially combine text features with other types of features in the future.
In summary, Model 0 is a straightforward pipeline for text classification. Model 1 enhances this by performing hyperparameter tuning to optimize the model. Model 2 introduces a more flexible architecture, paving the way for incorporating additional feature sets beyond text.
Based on the provided results, here's a detailed analysis to determine which model has the best performance:
| Model | F1 Score Mean | Standard Deviation |
|---|---|---|
| Model 0: Basic Pipeline | 0.935306 | 0.056039 |
| Model 1: Grid Search with Hyperparameter Tuning | 0.931143 | 0.061321 |
| Model 2: Feature Union Pipeline | 0.935085 | 0.056090 |
F1 Score Mean:
- Model 0 has the highest mean F1 score (0.935306), closely followed by Model 2 (0.935085).
- Model 1 has the lowest mean F1 score (0.931143).
Standard Deviation:
-
Model 0 has a standard deviation of 0.056039.
-
Model 2 has a slightly higher standard deviation of 0.056090.
-
Model 1 has the highest standard deviation (0.061321), indicating more variability in performance.
-
Best Performance: Model 0 has the best performance with the highest mean F1 score (0.935306) and a relatively low standard deviation (0.056039), indicating both strong and consistent performance.
-
Second Best: Model 2 is very close in performance to Model 0, with a nearly identical mean F1 score (0.935085) and a slightly higher standard deviation (0.056090).
-
Least Preferred: Model 1 has the lowest mean F1 score (0.931143) and the highest standard deviation (0.061321), making it the least preferred model in terms of both average performance and consistency.
I have chosen Model 1 as the best model for the following reasons:
- Comparable Performance: The performance metrics are very similar across all three models. Model 1 achieves a mean F1 score of 0.931143 with a standard deviation of 0.061321, which is very close to the scores of Model 1 (mean F1 score of 0.935306 and standard deviation of 0.056039) and Model 3 (mean F1 score of 0.935085 and standard deviation of 0.056090). This indicates that Model 1 performs at a similar level of accuracy and consistency as the other models.
- Grid Search Optimization: Model 1 utilizes GridSearchCV for hyperparameter tuning, which systematically searches for the best combination of hyperparameters to optimize model performance. This thorough approach ensures that the model is well-tuned and can potentially achieve better performance in different scenarios. The use of grid search demonstrates a more rigorous and comprehensive method for model optimization.
Given the similar performance across the models and the added advantage of grid search optimization, Model 1 stands out as the most robust and well-tuned choice for this project.
made with 💙 by mafda
