| CI/CD |   |
| Docs |  |
| Package |  |
| Meta |   |
Compute Energy & Emissions Monitoring Stack (CEEMS) (pronounced as kiːms) contains a Prometheus exporter to export metrics of compute instance units and a REST API server that serves the metadata and aggregated metrics of each compute unit. Optionally, it includes a TSDB load balancer that supports basic access control on TSDB so that one user cannot access metrics of another user.
"Compute Unit" in the current context has a wider scope. It can be a batch job in HPC, a VM in cloud, a pod in k8s, etc. The main objective of the repository is to quantify the energy consumed and estimate emissions by each "compute unit". The repository itself does not provide any frontend apps to show dashboards and it is meant to use along with Grafana and Prometheus to show statistics to users.
Although CEEMS was born out of a need to monitor energy and carbon footprint of compute workloads, it supports monitoring performance metrics as well. In addition, it leverages eBPF framework to monitor IO and network metrics in a resource manager agnostic way.
- Monitor energy, performance, IO and network metrics for different types of resource managers (SLURM, Openstack, k8s)
- Support NVIDIA (MIG and vGPU) and AMD GPUs
- Provides targets using HTTP Discovery Component to Grafana Alloy to continuously profile compute units
- Realtime access to metrics via Grafana dashboards
- Access control to Prometheus datasource in Grafana
- Stores aggregated metrics in a separate DB that can be retained for long time
- CEEMS apps are capability aware
Warning
DO NOT USE pre-release versions as the API has changed quite a lot between the pre-release and stable versions.
Installation instructions of CEEMS components can be found in docs.
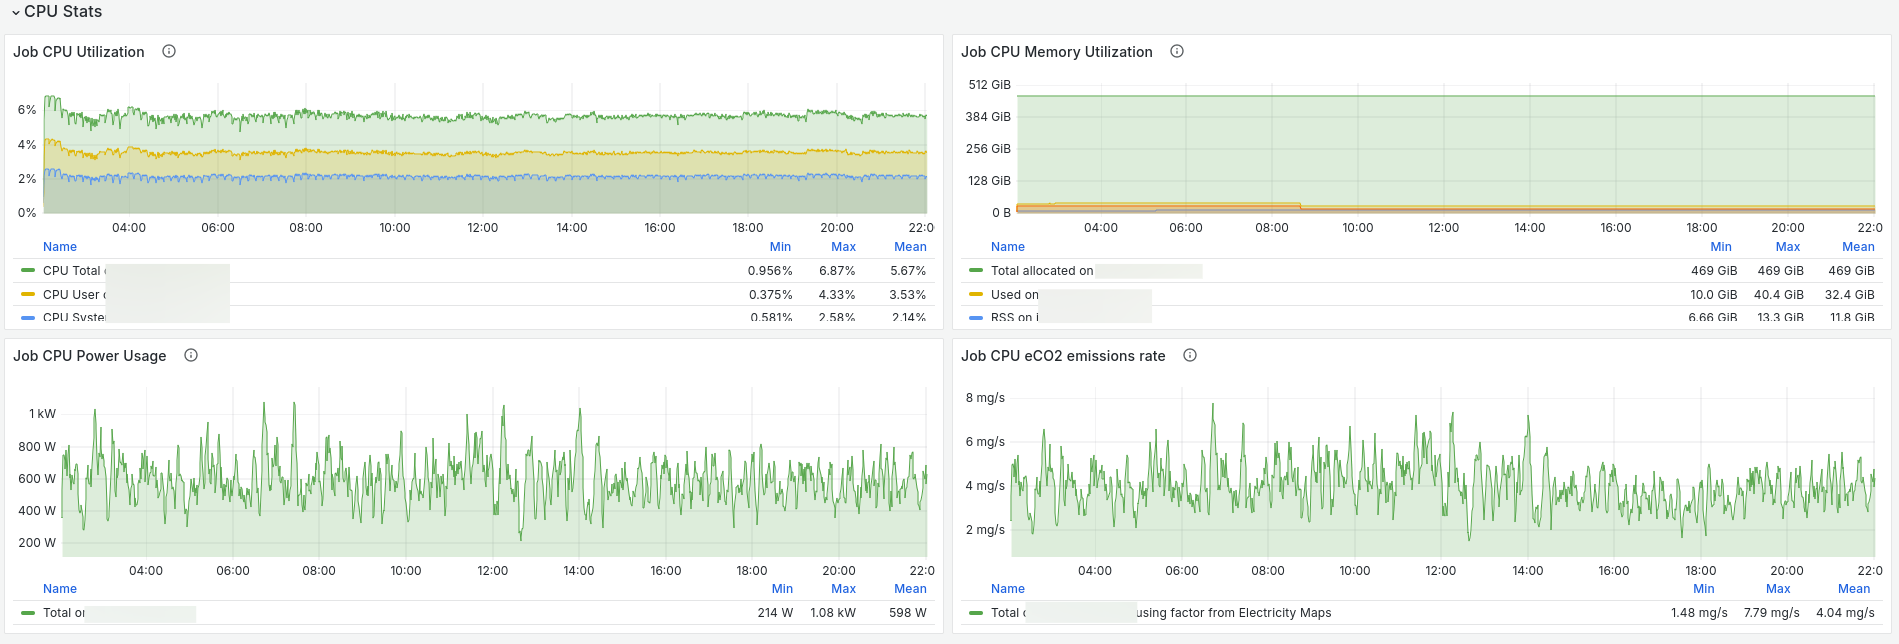
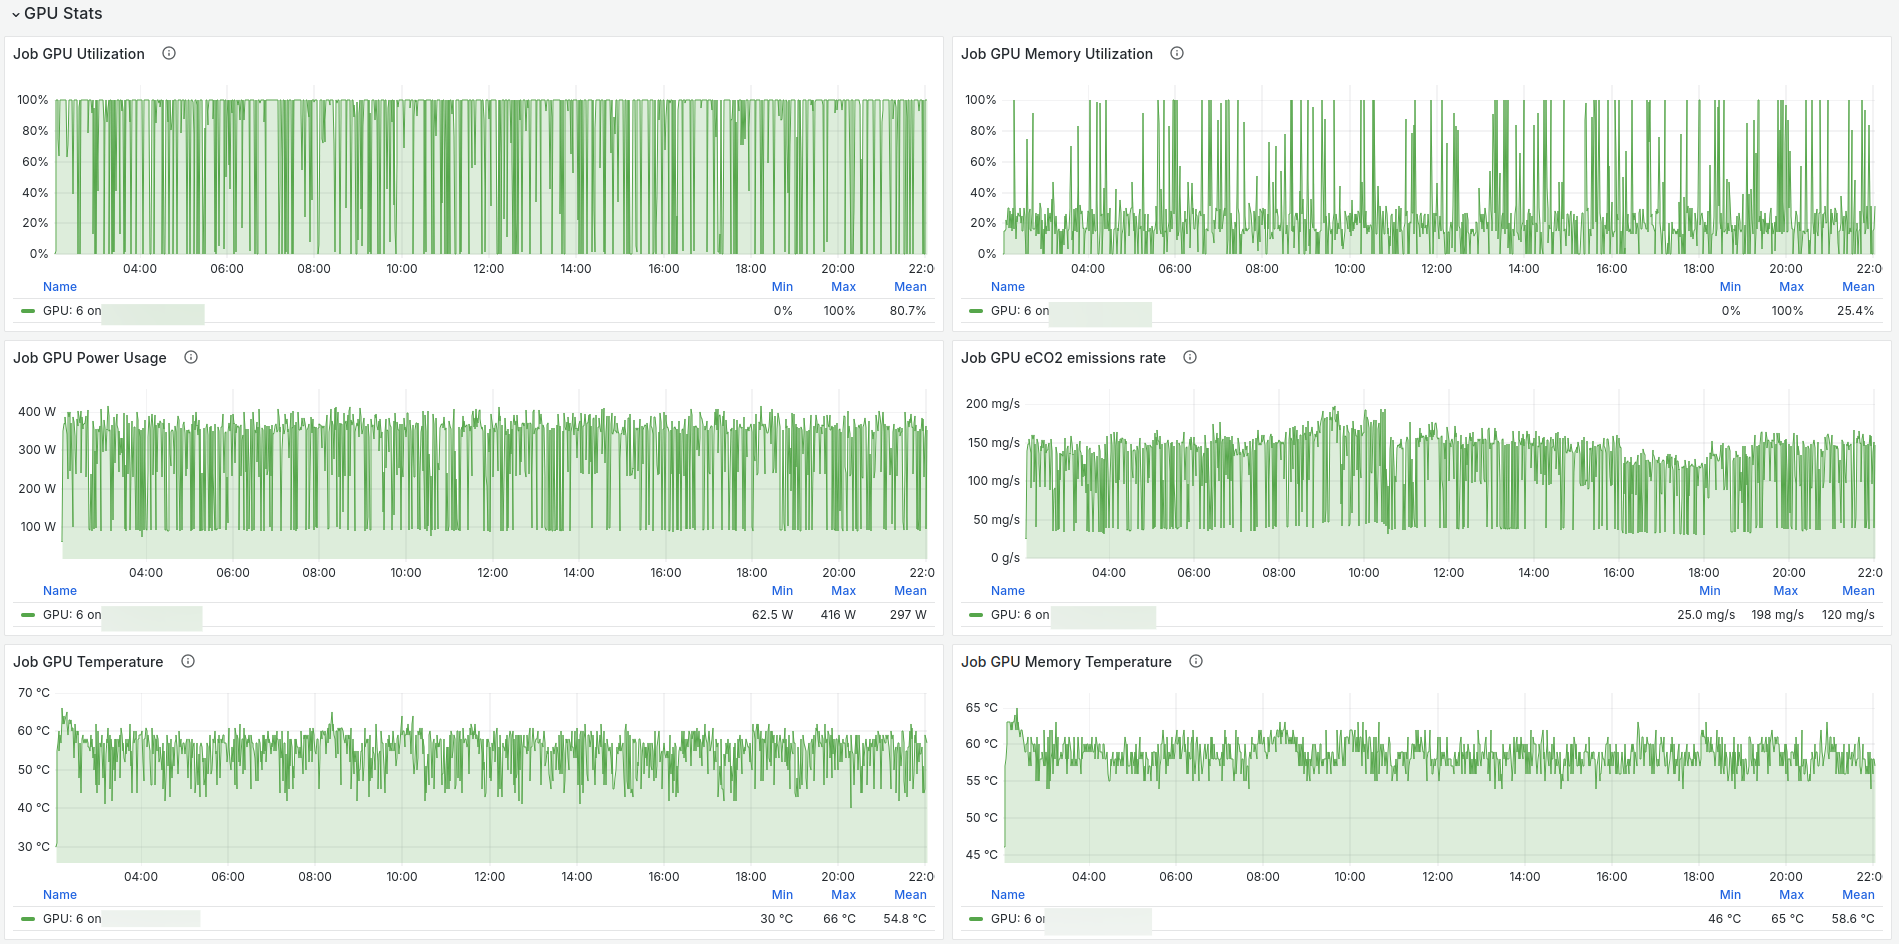
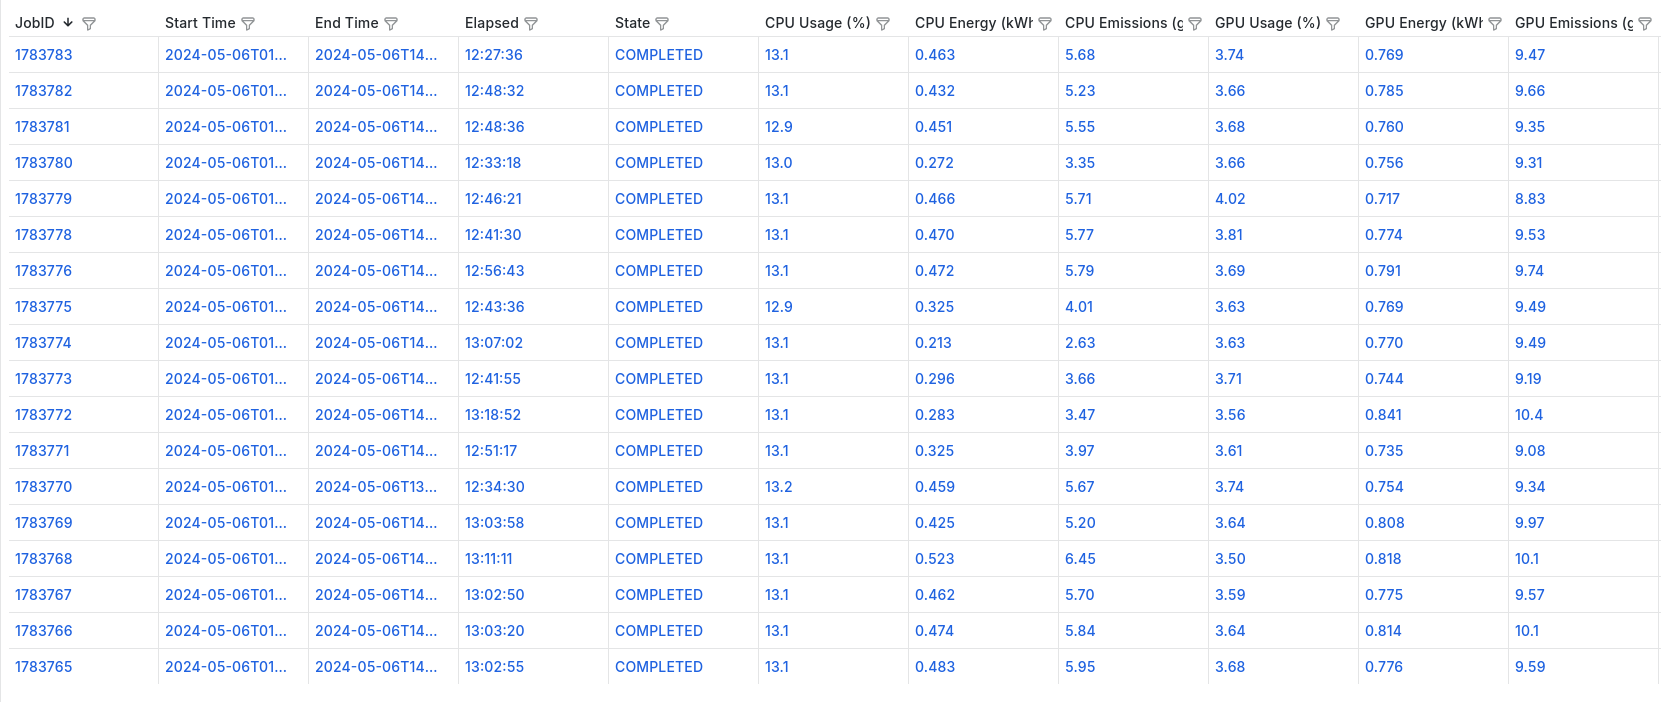
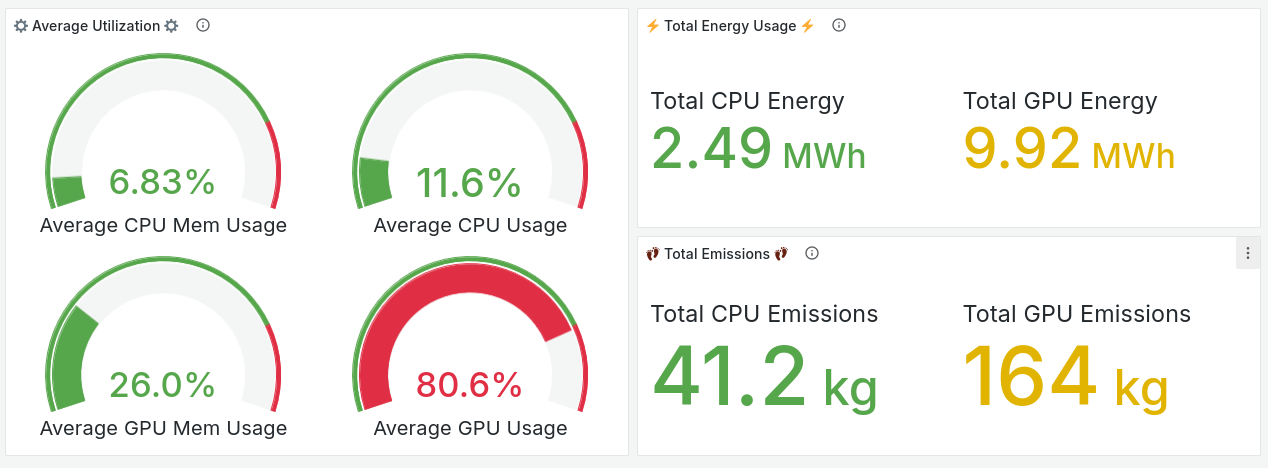
CEEMS is meant to be used with Grafana for visualization and below are some of the screenshots of dashboards.
We welcome contributions to this project, we hope to see this project grow and become a useful tool for people who are interested in the energy and carbon footprint of their workloads.
Please feel free to open issues and/or discussions for any potential ideas of improvement.
