Parkinson's Disease (PD) stands as a formidable challenge in the realm of neurological disorders. A progressive movement disorder affecting the nervous system, PD manifests through debilitating symptoms such as tremors, rigidity, bradykinesia, and postural instability1. While notable figures like Muhammad Ali, Michael J. Fox, and Pope John Paul II have grappled with PD, there remains no known cure for this affliction2.
Due to the absence of precise diagnostic tests and the invasiveness of several current methods, diagnosing PD poses complex difficulties. Blood tests, laboratory evaluations, and brain scans are used to rule out other probable diseases, although these methods sometimes include arduous procedures that might worsen the suffering of PD patients[1].
Using speech sample data processing, this research explores a non-invasive diagnosis route. The goal is to distinguish between those who have PD and those who do not by using specific characteristics in the acoustic qualities of their voices. The initiative intends to contribute to the creation of a user-friendly and accurate PD diagnosis tool by examining these auditory indicators.
The goal of this study is to develop speech sample data analysis as a viable non-invasive PD diagnosis technique. To discriminate between people with PD and those who do not have the disorder, particular acoustic indicators within speech samples have to be found. The study intends to contribute to the creation of a usable and trustworthy PD diagnosis tool by investigating a set of acoustic properties collected from speech recordings.
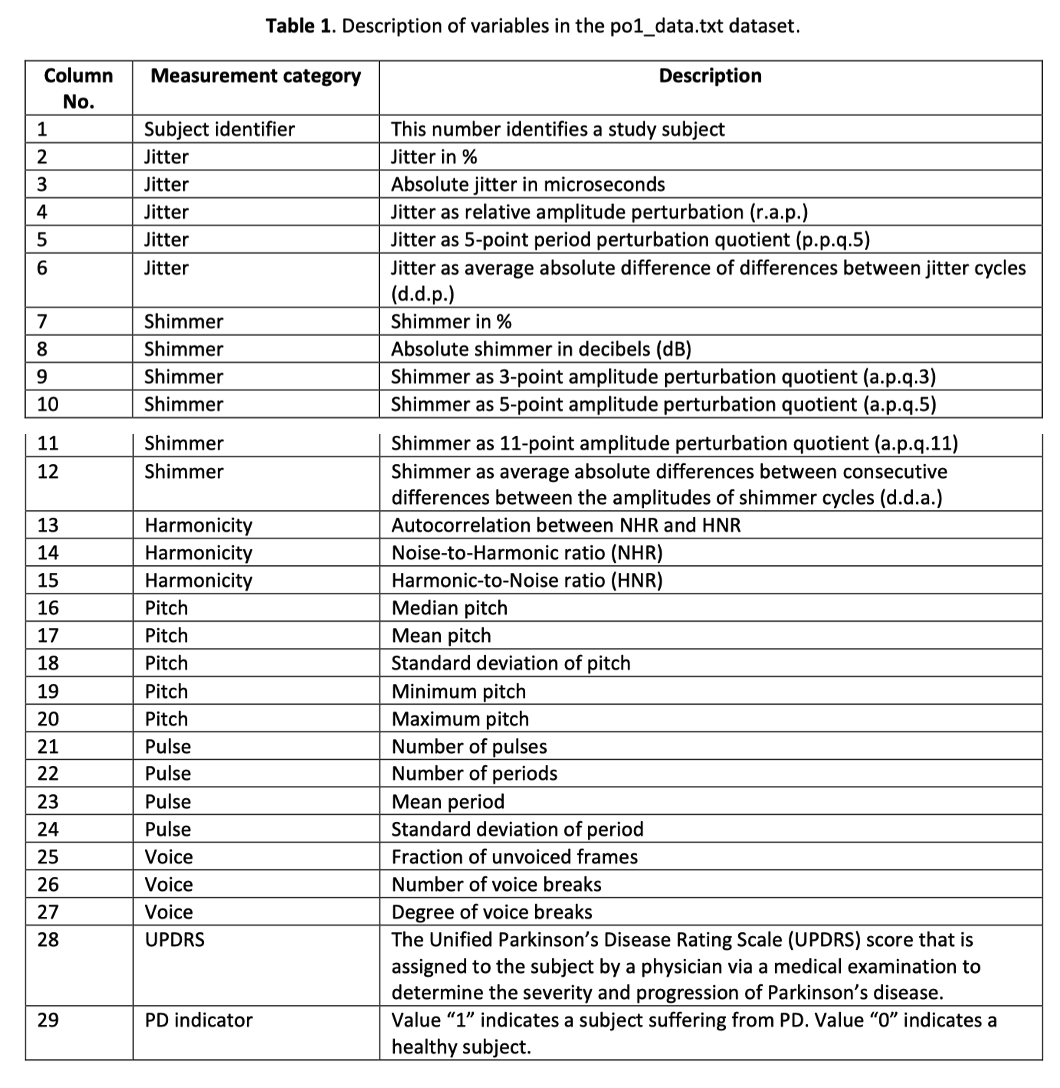
The 'po1_data.txt' dataset, which includes speech samples taken from both PD patients and healthy people, is used in this study. Each participant recorded 26 speech samples, including words, phrases, sustained vowels, and numerals. The basis for the following investigations is laid out by acoustic characteristics that were retrieved using Praat, a free acoustic analysis program[4].
The project unfolds through a series of steps. Check the Python code name named Parkinson_Disease_Feature_Selection.py
In order to get the dataset ready for analysis, it was loaded and preprocessed. It has 1039 entries and 29 columns with various acoustic elements taken from voice recordings for each entry. The data passed through the following processes:
The dataset has a shape of (1039, 29), indicating 1039 instances and 29 features.

The information about the dataset was obtained using the .info() method. It confirmed that the dataset contains no missing values, and all columns have either float64 or int64 data types.
Duplicate rows were checked using the .duplicated() method. No duplicate rows were found in the dataset.
To improve clarity, the column names were updated with more meaningful labels. The new column names provide insights into the acoustic attributes they represent.
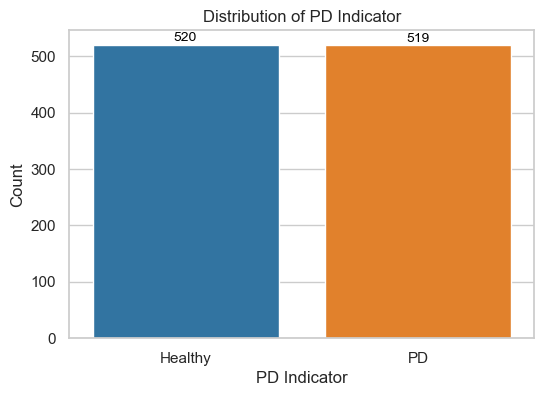
The categorical column PD indication in this dataset denotes individuals with or without Parkinson disease. As a result, we started by splitting the dataset into two data subsets: those without Parkinson's disease and those with it. The chart shows that in this sample set, the proportion of persons with and without PD is virtually equal.
df1: Voice samples from individuals without PD (Healthy). It contains 520 instances and 29 features.df2: Voice samples from individuals with PD (Affected). It contains 519 instances and 29 features.
These subsets will be used for comparative analysis and visualization to explore differences between healthy and PD-affected individuals.
In this section, we conducted a descriptive analysis of two sub-datasets representing individuals without Parkinson's disease (PD) and those with PD.
Our objective was to elucidate disparities in central tendencies and variability between the two groups. We initiated the analysis by calculating summary statistics using the .describe() function for both datasets, excluding irrelevant columns like 'subject_id'. Since there are 29 columns we may not be able to capture all the key details. To get a better glimpse, subsequently, we computed the differences in key statistics, focusing on mean, median, and standard deviation, to reveal insights into the impact of PD on these attributes.
| Feature | Mean Difference | Median Difference | StdDev Difference |
|---|---|---|---|
| MaxPitch | -33.810474 | -14.8815 | -21.029639 |
| UPDRS | 24.003854 | 23.0000 | 14.752265 |
| NumPeriods | 13.980606 | 6.5000 | 65.491394 |
| NumPulses | 12.222718 | 5.0000 | 64.193786 |
| MeanPitch | -11.558032 | -12.0885 | -13.053128 |
| MedianPitch | -9.447163 | -9.5840 | -16.707123 |
| StdDevPitch | -8.851501 | -4.1670 | -4.050640 |
| MinPitch | -5.580112 | -4.4405 | -7.840752 |
| FractionUnvoicedFrames | -5.068937 | -6.9150 | -0.342389 |
| DegreeVoiceBreaks | -3.803388 | -5.5395 | -2.463653 |
The project's feature selection reveals significant differences between Parkinson's disease present and absent datasets. The largest difference is in "MaxPitch," with a mean difference of 33.81 and significant deviations in median and standard deviation. The study also shows divergence in severity scores in "UPDRS," speech pattern attributes like "NumPeriods," and significant differences in mean and median in "MeanPitch," "MedianPitch," and "StdDevPitch." These findings provide insights into key differentiating features, guiding the selection of features for effective discrimination between Parkinson's disease cases and healthy subjects in the project.
Next, we generate side-by-side histograms to compare the distribution of numeric features between healthy and unhealthy individuals in two DataFrames (df1 for healthy and df2 for unhealthy displaying both distributions in different colours with hatch patterns. This visualization helps to easily observe differences in feature distributions between the two groups. Make sure to have the required libraries installed and adjust the code to match your DataFrame structure and data.
The histograms unveil the distribution characteristics of diverse features within the dataset. For instance, the attributes related to jitter measurements, such as 'Jitter(%)', 'Jitter(Abs)', and 'Jitter(RAP)', display positively skewed distributions suggesting longer tails toward higher values. The 'Shimmer' features, which gauge voice variability, exhibit varying degrees of spread and skewness, notably 'Shimmer(APQ5)'. 'Harmonicity' maintains a mean of around 0.85 and a standard deviation of 0.09, reflecting its relatively consistent distribution. 'NHR' (noise-to-harmonics ratio) possesses a positively skewed distribution indicating data skewness towards higher values. Features like 'NumPulses' and 'NumPeriods' are strongly positively skewed, indicative of potential outliers or variability. Meanwhile, attributes such as 'MeanPeriod' and 'StdDevPeriod' have distributions centred near zero, confirming their low variation. 'UPDRS', possibly denoting Parkinson's disease severity, demonstrates a right-skewed distribution.
The analysis of voice recording features has revealed outliers across various parameters, such as pitch variations, vocal intensity shifts, harmonics-to-noise ratios, and temporal patterns. These outliers hold potential significance, indicating instances of unusual pitch modulation, abrupt changes in vocal intensity, deviations in harmonics, or variations in speech pace. Their interpretation is context-dependent and necessitates domain expertise for a comprehensive understanding of their implications, whether they signify unique vocal events, data collection errors, or valuable insights. Careful consideration should be given to the decision to handle these outliers, as they offer valuable cues about the underlying vocal characteristics and behaviours within the recordings.
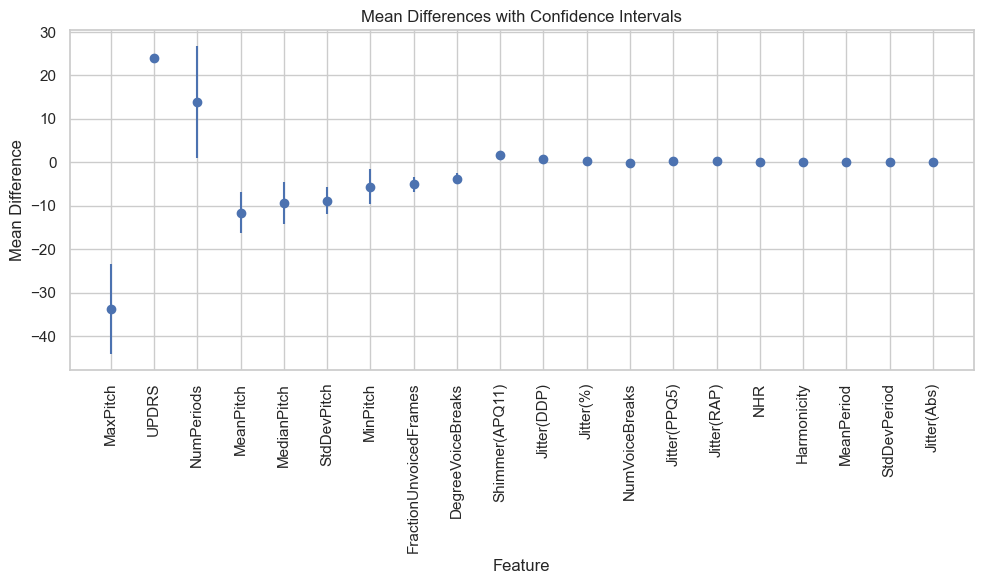
For a t-test, we have used a 95% confidence level. This means that there is a 95% chance that the true difference in means is within the confidence interval.
| Feature | Mean Difference | Confidence Interval |
|---|---|---|
| MaxPitch | -33.810 | (-44.17996795243055, -23.4409801756263) |
| UPDRS | 24.004 | (23.105359296668126, 24.902347832426287) |
| NumPeriods | 13.981 | (1.114176699358996, 26.847035691333172) |
| MeanPitch | -11.558 | (-16.35437150895066, -6.761692949327117) |
| MedianPitch | -9.447 | (-14.256260205293817, -4.6380662879624275) |
| StdDevPitch | -8.852 | (-11.987994936130853, -5.715006667544863) |
| MinPitch | -5.580 | (-9.627504098689435, -1.5327197578393372) |
| FractionUnvoicedFrames | -5.069 | (-6.861681929109734, -3.27619271888196) |
| DegreeVoiceBreaks | -3.803 | (-5.099021178822456, -2.5077541139002353) |
| Shimmer(APQ11) | 1.772 | (1.2592897573566089, 2.2846059705982564) |
In this study, the mean difference for the MaxPitch feature is -33.810, which means that the mean MaxPitch value for the Parkinson's disease group is 33.810 Hz lower than the mean MaxPitch value for the control group. The confidence interval for this difference is (-44.17996795243055, -23.4409801756263), which means that we can be 95% confident that the true difference in mean MaxPitch values is between -44.17996795243055 Hz and -23.4409801756263 Hz.
In the conducted hypothesis testing analysis, we explored the differences in various acoustic features, pitch-related measures, and clinical scores between healthy and unhealthy individuals. The findings provided compelling evidence of significant distinctions between the two groups across multiple dimensions.
Fail to reject H₀:
| Feature | Z-Score | Critical Z-Value | Result |
|---|---|---|---|
| HNR | 1.298 | 2.576 | Fail to reject H₀ |
| MinPitch | -1.913 | 2.576 | Fail to reject H₀ |
| NHR | -2.436 | 2.576 | Fail to reject H₀ |
| NumPeriods | 1.508 | 2.576 | Fail to reject H₀ |
| NumPulses | 1.312 | 2.576 | Fail to reject H₀ |
| NumVoiceBreaks | -2.559 | 2.576 | Fail to reject H₀ |
| Shimmer(%) | 0.318 | 2.576 | Fail to reject H₀ |
| Shimmer(APQ3) | -0.573 | 2.576 | Fail to reject H₀ |
| Shimmer(APQ5) | -0.707 | 2.576 | Fail to reject H₀ |
| Shimmer(Abs) | 0.908 | 2.576 | Fail to reject H₀ |
| Shimmer(DD) | -0.573 | 2.576 | Fail to reject H₀ |
| StdDevPeriod | -1.879 | 2.576 | Fail to reject H₀ |
Features where the Null Hypothesis (H₀) is Not Rejected: In contrast, certain features did not surpass the critical z-values, indicating that there was insufficient evidence to claim significant differences between healthy and unhealthy individuals for these specific aspects. These results suggest that, at the given significance level, these features did not exhibit substantial disparities. While the differences were not statistically significant, these features still contribute to a holistic understanding of the comparison between the two groups.
Reject H₀:
| Feature | Z-Score | Critical Z-Value | Result |
|---|---|---|---|
| DegreeVoiceBreaks | -4.073 | 2.576 | Reject H₀ |
| FractionUnvoicedFrames | -3.923 | 2.576 | Reject H₀ |
| Harmonicity | 2.601 | 2.576 | Reject H₀ |
| Jitter(%) | 3.180 | 2.576 | Reject H₀ |
| Jitter(Abs) | 5.482 | 2.576 | Reject H₀ |
| Jitter(DDP) | 3.615 | 2.576 | Reject H₀ |
| Jitter(PPQ5) | 3.613 | 2.576 | Reject H₀ |
| Jitter(RAP) | 3.615 | 2.576 | Reject H₀ |
| MaxPitch | -4.524 | 2.576 | Reject H₀ |
| MeanPeriod | 2.651 | 2.576 | Reject H₀ |
| MeanPitch | -3.344 | 2.576 | Reject H₀ |
| MedianPitch | -2.726 | 2.576 | Reject H₀ |
| Shimmer(APQ11) | 4.796 | 2.576 | Reject H₀ |
| StdDevPitch | -3.916 | 2.576 | Reject H₀ |
| UPDRS | 37.069 | 2.576 | Reject H₀ |
Features that reject the null hypothesis (H0) These traits showed z-scores that were higher than the necessary z-values, showing major distinctions between healthy and sick people. For instance, "DegreeVoiceBreaks" had a z-score of -4.073, which was significantly higher than the threshold of 2.576 and resulted in the null hypothesis being rejected. With a z-score of -3.923, "FractionUnvoicedFrames" also demonstrated a clear difference between the groups. In addition, traits like "Harmonicity" had a z-score of 2.601, emphasising the divergence between the two groups and assisting in the rejection of the null hypothesis. A number of other measures, including various "Jitter" metrics, "MaxPitch," "MeanPeriod," "MeanPitch," "MedianPitch," "Shimmer(APQ11)," "StdDevPitch," and "UPDRS" scores, all displayed z-scores that noticeably exceeded the necessary values, emphasising the significance of these deviations.
We employ a thorough combination of hypothesis testing and feature sorting to determine which traits are most crucial for our inquiry. As a first step, we test the null hypothesis and record the results in the "reject_results.csv" file, either rejecting it or failing to do so. After sorting the features with mean differences and confidence intervals, the results are stored in the file "sorted_results.csv." Using NumPy's np.intersect1d() method, we find the features that display substantial changes based on sorting and consistently indicate relevance through hypothesis testing. Based on its shared traits, we decided to investigate this pick further. This method simplifies our analytical processes by directing our attention to characteristics that consistently point to significance and distinguishing characteristics. In the end, this strategy enhances the accuracy and robustness of our study by focusing on traits that consistently have value across numerous analytical views.
In our feature selection strategy, feature sorting (with the top 10 mean differences) and null hypothesis rejection share the following important properties.
- DegreeVoiceBreaks
- FractionUnvoicedFrames
- MaxPitch
- MeanPitch
- MedianPitch
- Shimmer(APQ11)
- StdDevPitch
- UPDRS
In this step, we have used our domain knowledge and instincts to select the final features. As we can see, during the selecting feature process, there are central tendencies like Mean, Median and SD. Since all these are relevant to one another, we will select one of them. By going through the Histogram and Mean differences calculation, we were able to decide to exclude columns MeanPitch and MedianPitch by recovering StdDevPitch. It has a low gap of confidence interval and as we can see from the histogram, people with PD had SD fall in the low margin i.e. 90% of data lies within values of 25.
UPDRS is an undeniable feature that is directly related to differentiating healthy and unhealthy people which has a narrow confidence interval as well as features in Histogram. We will keep MaxPitch as well because it has the highest mean differences out of all the features even though the confidence interval is large.
We exclude FractionUnvoicedFrames and DegreeVoiceBreaks as frequency for different values as observed in the Histogram can contradict our result as they seem fairly similar.
As supported by hypothesis testing, Jitter(%), Jitter(Abs), Jitter(DDP), Jitter(PPQ5) and Jitter(RAP) are interesting features that can help to detect PD. By looking into Histograms, confidence intervals and mean differences we decided to choose Jitter(%) as the next feature. Some of the jitter features have 0 mean differences and some have fairly low ones. It was the choice between Jitter(%) and Jitter(DDP) that had significant mean differences. By looking into the Histogram, we decided to choose Jitter(%) as we believe this will help to detect PD with more certainty.
The project's analyses and visualizations unveiled notable discrepancies in acoustic features between healthy individuals and those with PD. These findings hold promise for the advancement of a non-invasive diagnostic instrument for PD, potentially enabling timelier interventions and improved patient outcomes.
The final columns after all the analysis are;
- MaxPitch
- StdDevPitch
- UPDRS
- Jitter(%)
- PD indicator
Next, we can use machine learning techniques for predictive modelling, and clinical validation to assess the reliability of identified PD to help the patients in early phases. Also, We can predict the motor and the total UPDRS scores assigned by a physician to people with Parkinson’s Disease.
In this effort, we used descriptive analysis, inferential statistical tests, and domain knowledge to comprehensively analyse voice sample data to find discrete acoustic indicators for diagnosing Parkinson's Disease (PD). We found that MaxPitch, StdDevPitch, UPDRS, Jitter(%), and the PD indicator exhibited consistent significance in differentiating PD-affected individuals from healthy individuals through careful selection guided by hypothesis testing, mean difference calculations, and feature distribution visualisations. Our experiment emphasises the potential of speech analysis as a useful method for early PD identification, even though more validation and machine learning models are required. This choice shows promise for the creation of a non-invasive diagnostic tool.
Footnotes
-
National Institute of Neurological Disorders and Stroke. (2023). Parkinson's Disease Information Page. https://www.ninds.nih.gov/healthinformation/disorders/parkinsons-disease ↩
-
Parkinson's Foundation. (2023). Notable Figures. https://www.parkinson.org/understanding-parkinsons/statistics/notable-figures ↩


