This package provides functions for easy visualisation of data retrieved with the REST API clients that comprise the hapiverse: gwasrapidd and quincunx.
# install.packages("remotes")
remotes::install_github("maialab/hapiviz")Making a forest plot of performance metrics effect sizes:
library(quincunx)
library(hapiviz)

ppms <- get_performance_metrics(sprintf('PPM%06d', c(1:5, 14:18, 83, 85)))
forest_plot(ppms@pgs_effect_sizes)Creating a summarising report for a scores object with
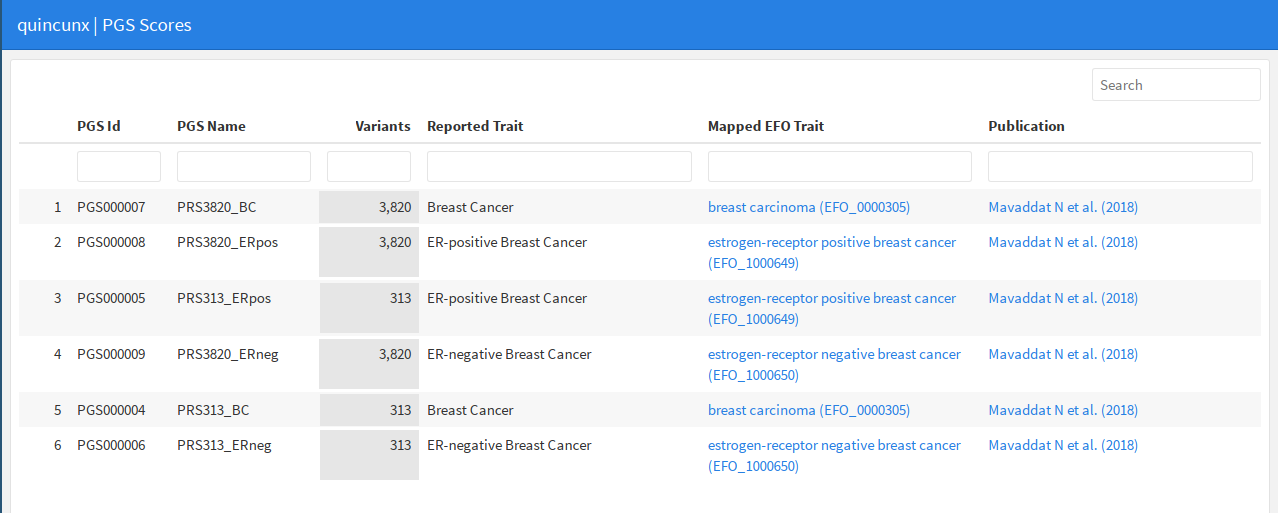
quincunx_pgs_report():
library(quincunx)
library(hapiviz)

# Get the polygenic scores associated with pubmed id 30554720
mavaddat_scores <- get_scores(pubmed_id = '30554720')

# This will show a html table of scores in the Viewer pane of RStudio.
# Use the `file` argument if you want to save the output to an html file.
quincunx_pgs_report(mavaddat_scores)
