Contraceptive Decision-Making in Developing Countries
Repository for analysis and design of the factsheet---and any interactive visualisations that may follow--- for the 14(1) issue of Population Horizons.
The Demographic and Health Survey (DHS) Programme has been conducting surveys to monitor indicators in the areas of population, health, and nutrition in over 90 countries for over thirty years. Since \emph{Wave 4} they have been asking the following question of women who are married or cohabiting and who use contraception:
"Would you say that using contraception is mainly your decision, mainly your husband's/partner's decision, or did you both decide together?"
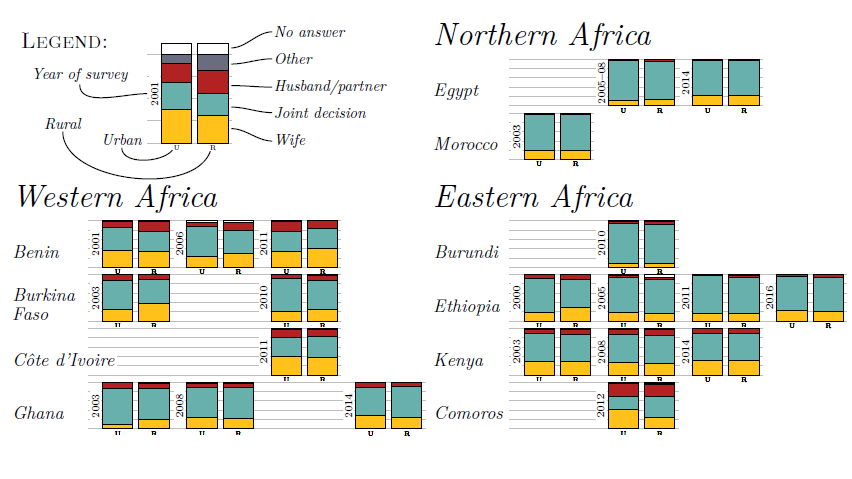
This analysis brings together the answers of over 800,000 women from a total of 144 surveys conducted in 67 countries---in some only once, in others up to four times over four waves from 1998 to 2016. The factsheet provides a convenient visualisation of the patterns, geographical and temporal as can be seen from this extract here.

- The factsheet/poster itself--PH14.01.Factsheet.pdf
- The prospective age old-age threshold calculated for all 20 countries for the period 1953-2098 along with the proportions of the population over 65 and over the threshodl--final.data.csv
- The detailed methodology report--methods.pdf
[This is a brief outline of the methodology, for more detail see the methods.pdf` report---which is currently still under constructions, sorry]
The starting point for this analysis was 321 Individual recode files. The question comes from the individual questionnaires, and started being asked from phase IV onwards, although not always. Removing the files which did not have the question v632, or where all the answers were NA leaves us with 144 files.
This is 144 surveys conducted in 67 countries over the period 1998-2016.
For each of the surveys only six variables are extracted (see recode questionnaires for details):
v000-- the wave code (this turns out to be a bad idea, since waves don't correspond to phases, go figure)v005-- the sample weights for individualsv102-- de facto type of place of residence (rural/urban)v312-- current contraception usev502-- current marital statusv632-- the question: who decides on contraception.
Denominator: The question is only asked of women currently married or cohabiting, who are currently using contraception.
While in some cases the vv632 question did gave 9 coded for missing values, this was not the case most of the time. So the variables v312 and v502 are used to ensure the correct denominator and the number of missing answers, looking only at women:
- who are currently married/cohabiting
v502 == 1, and - who are currently using contraception
v312 > 0
Out of each dataset the weighted counts are calculated for the crosstabulation of v102 and v632 for eligible women. The possible answers for v632 are:
- 1--wife
- 2--husband
- 3--both
- 6--other
- (9--missing)
However the last two options are not present in all surveys, so the crosstabulations are sized 2x3, 2x4 or 2x5, depending on the possible answers. Because 9 missing are explicitly listed in a few surveys, but not in most of them, in the latter the NAs are calculated by elimination. This is how Kenya and Turkey stand out so massively, these respondents were not coded as 9s, but as NAs. But I have no way of knowing how to interpret these outliers, i.e. the accompanying documentation is not helpful to figure out what happened here.
These counts are weighted using the women's sample weights (see here), then the column-wise percentages are calculated to get the distribution within each type of residence (urban and rural), with 100% being the number of valid answers.
The questions in each individual phase can be found in the following four model questionnaires:
- DHS IV Model Questionnaire p. 89
- DHS V Model Questionnaire p.W49
- DHS VI Model Questionnaire p.W.46
- DHS VII Model Questionnaire p.W.62
The whole process from downloading the data, extracting the files, cleaning and processing the data, saving outputs, plotting the charts and laying out the final poster/factsheet is fully documented and automated, and made publicly available in this repository.
The repository contains all the code and instructions to recreate the whole process, short of the actual data themselves, which are available through a free (for non-commercial purposes) registration with DHS. Even so, the summary tables that are required to produce the charts are made available here as well: final.data.csv.
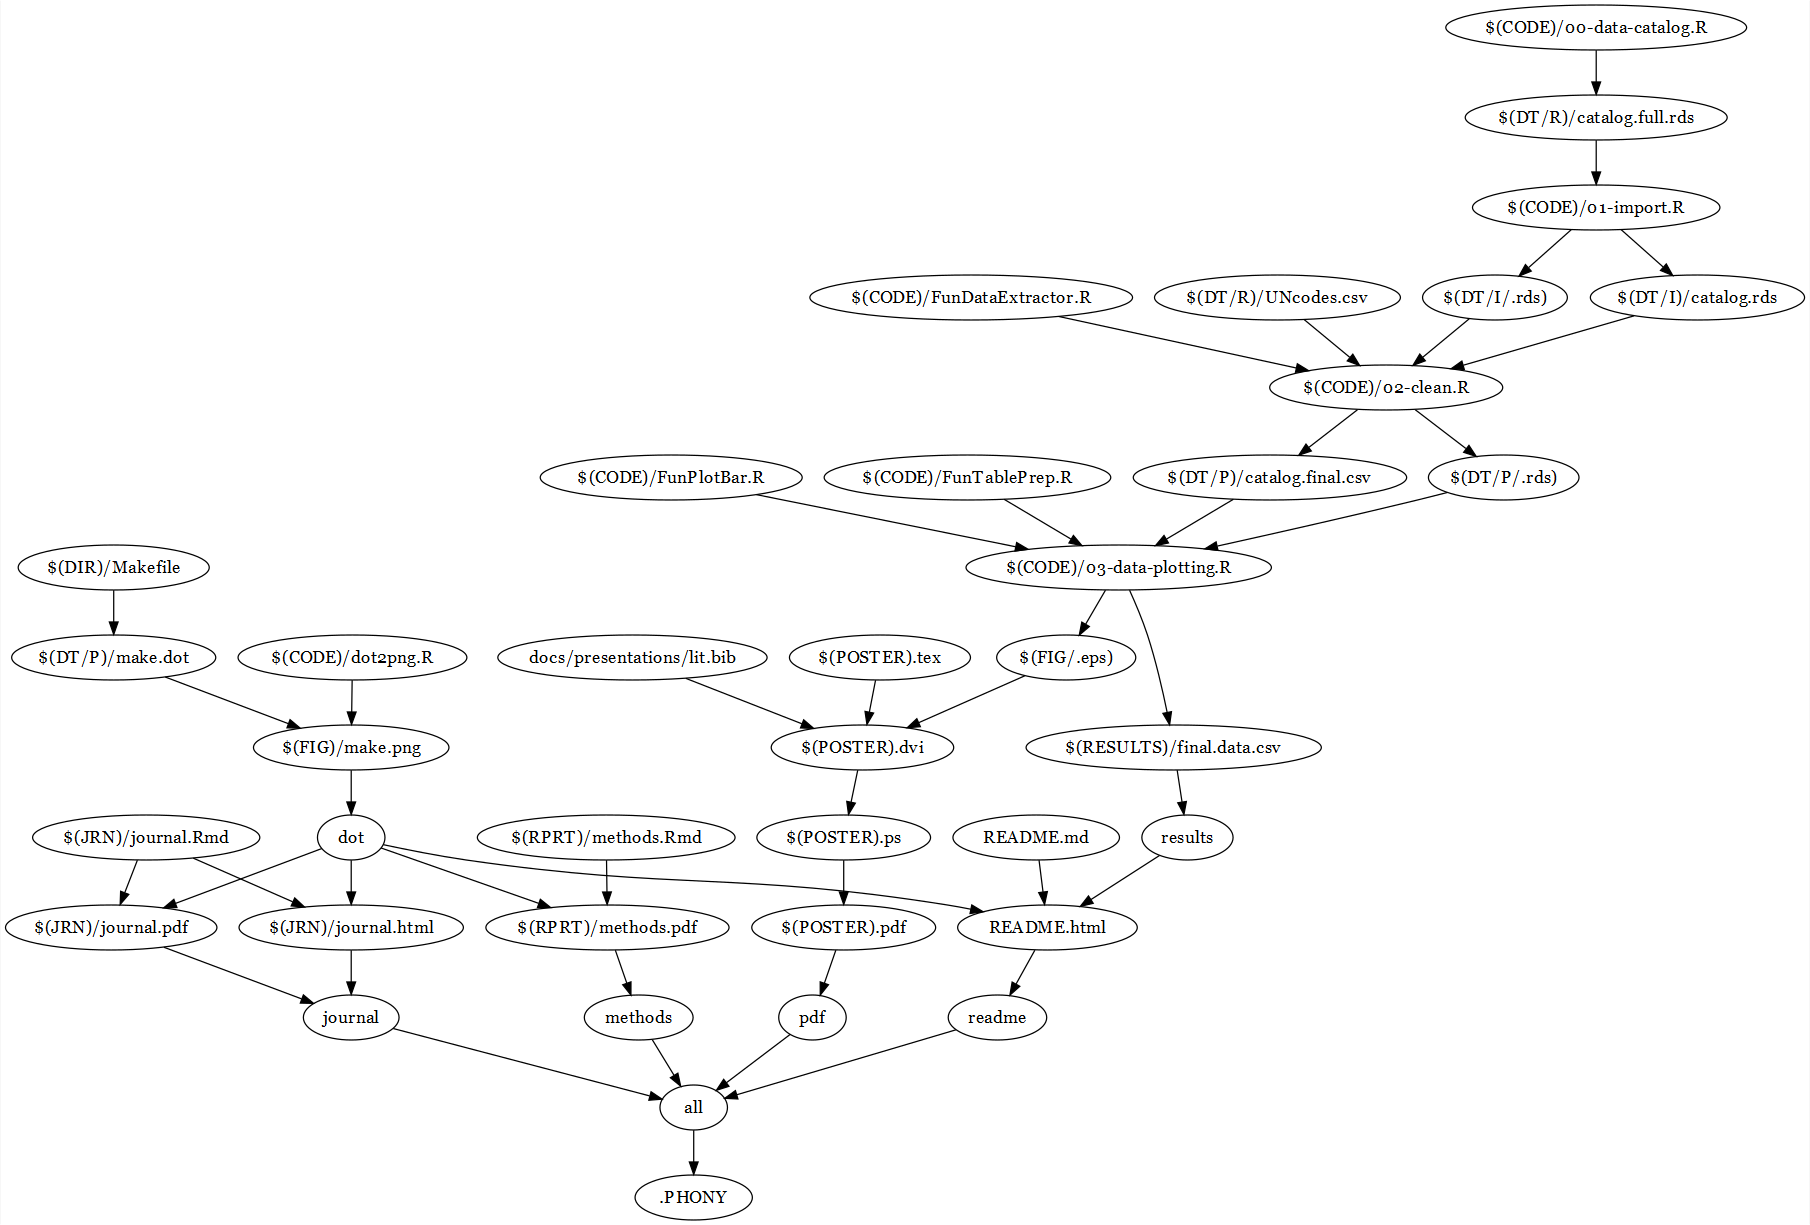
The makefile is visualised below---be warned, this is the current state of the project, which is still in progress.
DHS data requires free (for non-commercial purposes) registration. With the help of the lodown package all the data download and extraction is automated.
R, Rstudio (pandoc, make), Python, some sort of unzipping utility... If it works, don't break it.
- Maja Založnik
This project is licensed under the ?
@ajdamico
