I attached zip that contain all parts of an app except dependences. Unzip it, move to a folder and install all dependencies by executing: npm install
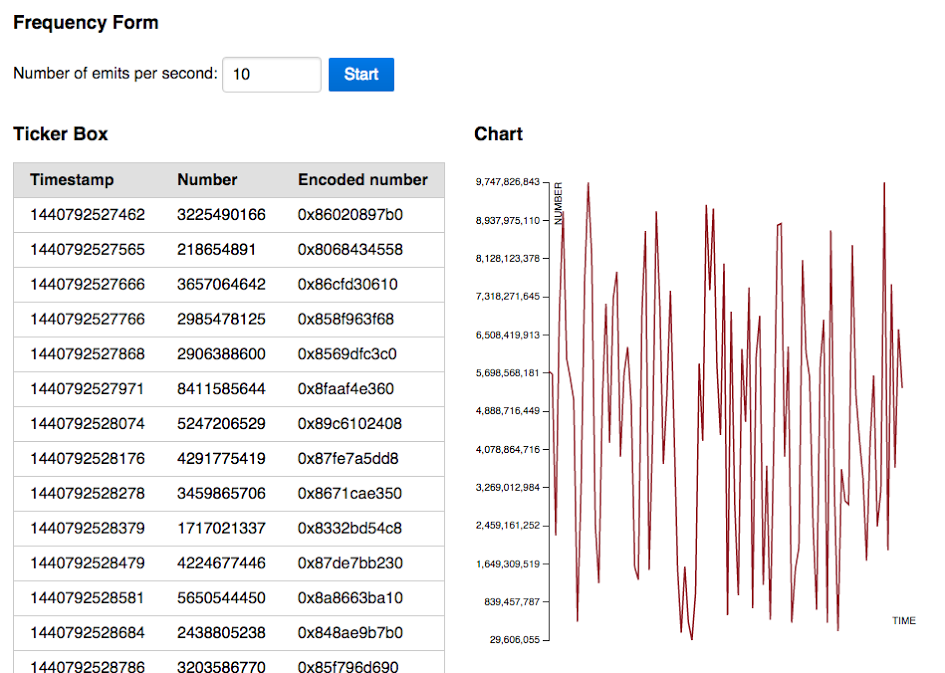
To run the app execute in terminal: node app Then open emmiterPage in browser http://localhost:3000/emitterPage, enter number of emits per second and click start. A chart will be rendered after receiving two pieces of data.
To test for success in encoding a module, execute: mocha
I used this chart library adapted for react: https://github.com/fiatjaf/react-charts To make pretty view I used simple CSS framework Pure.css: http://purecss.io/ Other tools that I used: React.JS, jQuery, JSXTransformer, Socket.IO