"""
Original repo: https://github.com/girunlu/neuron.ai-projects.git
This Streamlit demo combines functionalities for image manipulation and LSTM training with tabular data.
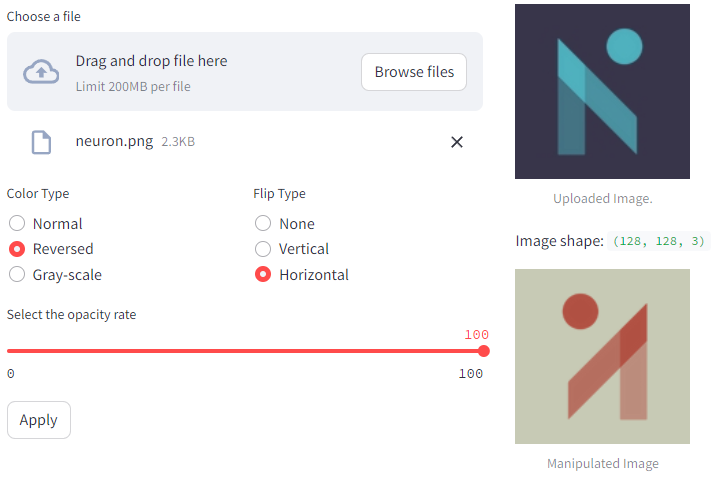
The Image Processing tab allows users to upload an image and apply various manipulations using sliders.
- Users can choose an image file using the file uploader.
- Manipulations include color adjustments, flipping, and opacity control.
- The original and manipulated images are displayed side by side.
# Example Usage
import streamlit as st
import numpy as np
import cv2

uploaded_file = st.file_uploader("Choose a file")
if uploaded_file is not None:
    img = np.frombuffer(uploaded_file.read(), dtype=np.uint8)
    img = cv2.imdecode(img, cv2.IMREAD_COLOR)
    img = cv2.cvtColor(img, cv2.COLOR_BGR2RGB)
    # ... (manipulation logic)
    st.image(img, caption='Uploaded Image.', use_column_width=False, width=175)
st.image(new_image, "Manipulated Image", use_column_width=False, width=175)The Training LSTM with Tabular Data tab focuses on training an LSTM model with tabular data.
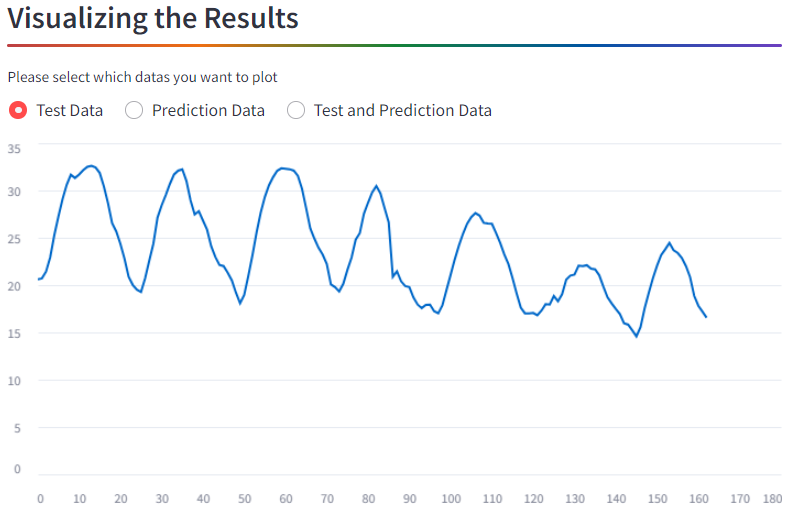
- Displays a temperature log in Celsius degrees over a specific time range.
- Users can start the training process with a button click.
- Data preprocessing, training, and prediction isolation are displayed with loading spinners.
- Visualizes the training data and provides options to plot test data, prediction data, or both.
# Example Usage
import streamlit as st
import pandas as pd
import time

df = pd.read_csv("./formatted.csv")
st.dataframe(df, use_container_width=True)

if st.button("Start Training"):
    with st.spinner('Data is preprocessing...'):
        time.sleep(1.3)
    with st.spinner('Training...'):
        time.sleep(2.2)
    with st.spinner('Isolating the Predictions...'):
        time.sleep(1.2)
    st.success('Done!', icon="✅")

st.line_chart(d1, use_container_width=True)

plot = st.radio(
    "Please select which datas you want to plot",
    ["Test Data", "Prediction Data", "Test and Prediction Data"], index=0, horizontal=True)
# ... (plotting logic)
st.line_chart(ddf)Thank you for participating in this demo! For more information and to stay up-to-date with our events, visit Neuron AI.
Note: The chatbot section has been commented out due to potential issues with Streamlit regulations. If needed, please uncomment and provide additional context.

