eYe is a simple application that enables the realtime monitoring of Spring Boot software.
2.0.0.0
The two version of eYe had a split for using rest or messaging RabbitMQ. We integrated software with eYe and it sent the metrics to the monitor. Now, one last version, the monitor is finished. eYe now integrates with Elasticsearch and Kibana.
The relevance of a software monitoring is to identify strategic points of most used functionalities, identify bottlenecks and anticipate possible errors, thus adding value to the product.
the system that will be integrated must be development in Spring Boot
- eye: Integration library where it should be added as a dependency in the software where you want to collect the metrics;
Change "@IP@" for your IP.
elasticsearch:
    image: elasticsearch:latest
    ports:
      - "9200:9200"
      - "9300:9300"
    volumes:
      - elasticsearch1:/usr/share/elasticsearch/data

 logstash:
    image: logstash:latest
    command: logstash -e 'input { tcp { port => 5000 } } output { elasticsearch { hosts => "@IP@" } }'
    ports:
      - "5000:5000"

 kibana:
    image: kibana
    ports:
      - "5601:5601"
    environment:
      - ELASTICSEARCH_URL=http://@IP@:9200
docker-compose up
Add this dependency in your software.
<dependency>
    <groupId>br.com.eye</groupId>
    <artifactId>eye</artifactId>
    <version>2.0.0.0</version>
</dependency>In the application.properties add the keys below. The main one is "eye.url" which should be where the Elasticsearch server will be.
# name the application
spring.application.name=name-sistema

# version the application
spring.application.version=0.0.0.1

# url the elasticsearch
eye.url=http://localhost:9200

# When you necessary disable all logs, and set disabled=true
eye.disabled=false

# user the elasticsearch
eye.user.elasticsearch=

# pass the elasticsearch
eye.pass.elasticsearch=

# When you put @Sensor in your method, you need include one TAG.
# With properties you have the possibility active one or more tags and excludes the diferents.
# Ex1:
eye.tags.active=tag1

# Ex2:
eye.tags.active=tag1, tag2
Add annotation
@ImportAutoConfiguration(value={EyeConfig.class}) @Sensor(description="Name", tags="test", type=TypesData.API_ENDPOINT)
@RequestMapping("/exemple")
public void testar() {
System.out.println("Hello...");
}The @Sensor annotation is the primary one and should be used in every method you want to monitor. Can be monitored endpoints, service, repositorys, etc ...
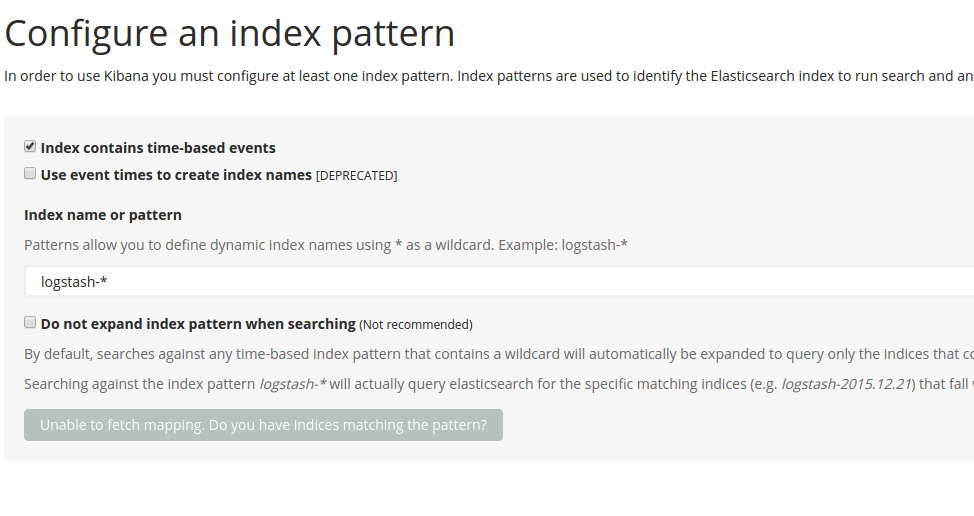
First we need to add index the Kibana. The eYe send information with "spring.application.name" + YYYY-MM-DD. In our exemple, we add o index "nome-sistema*" Now folder use the index to make the queries.
