End to End BI Solution as a final task for the Analytics & BI Specialization at PUC Minas
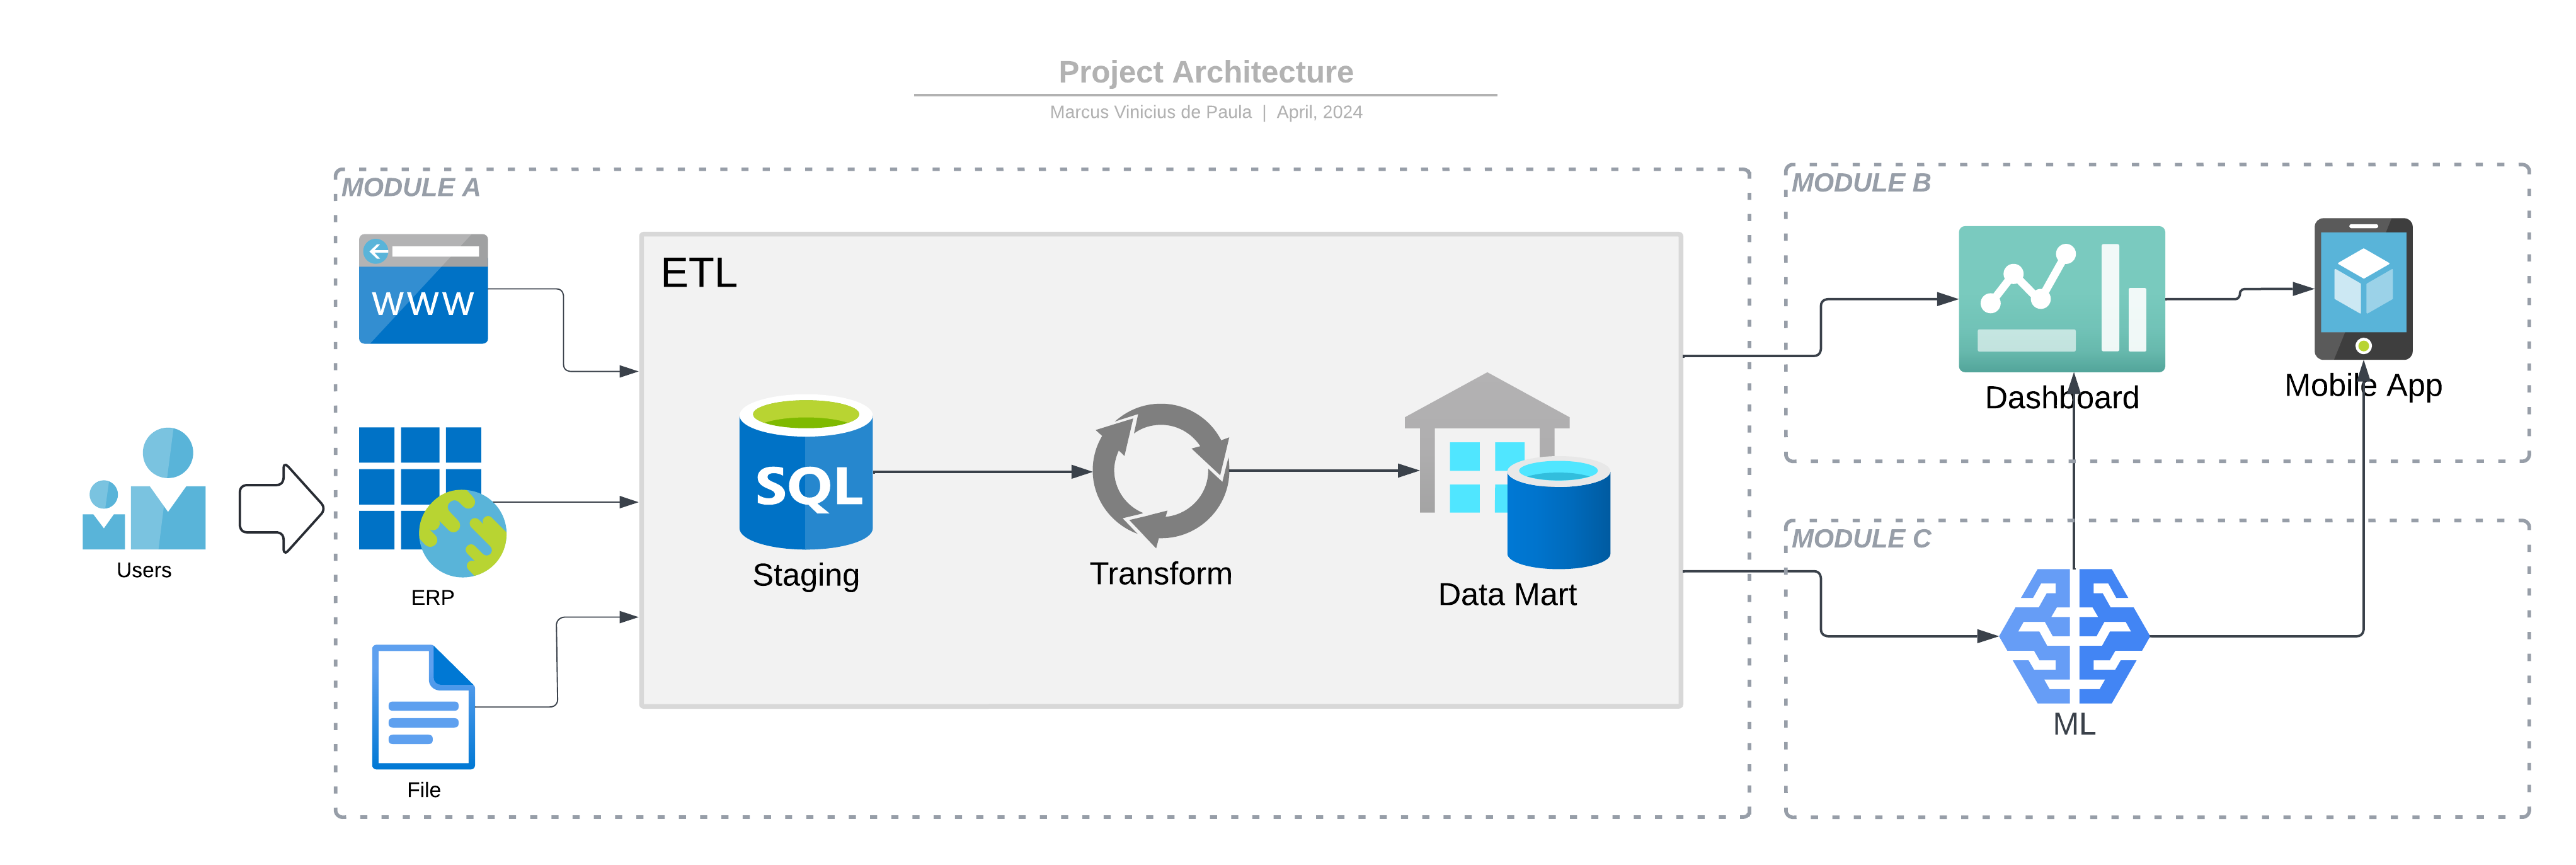
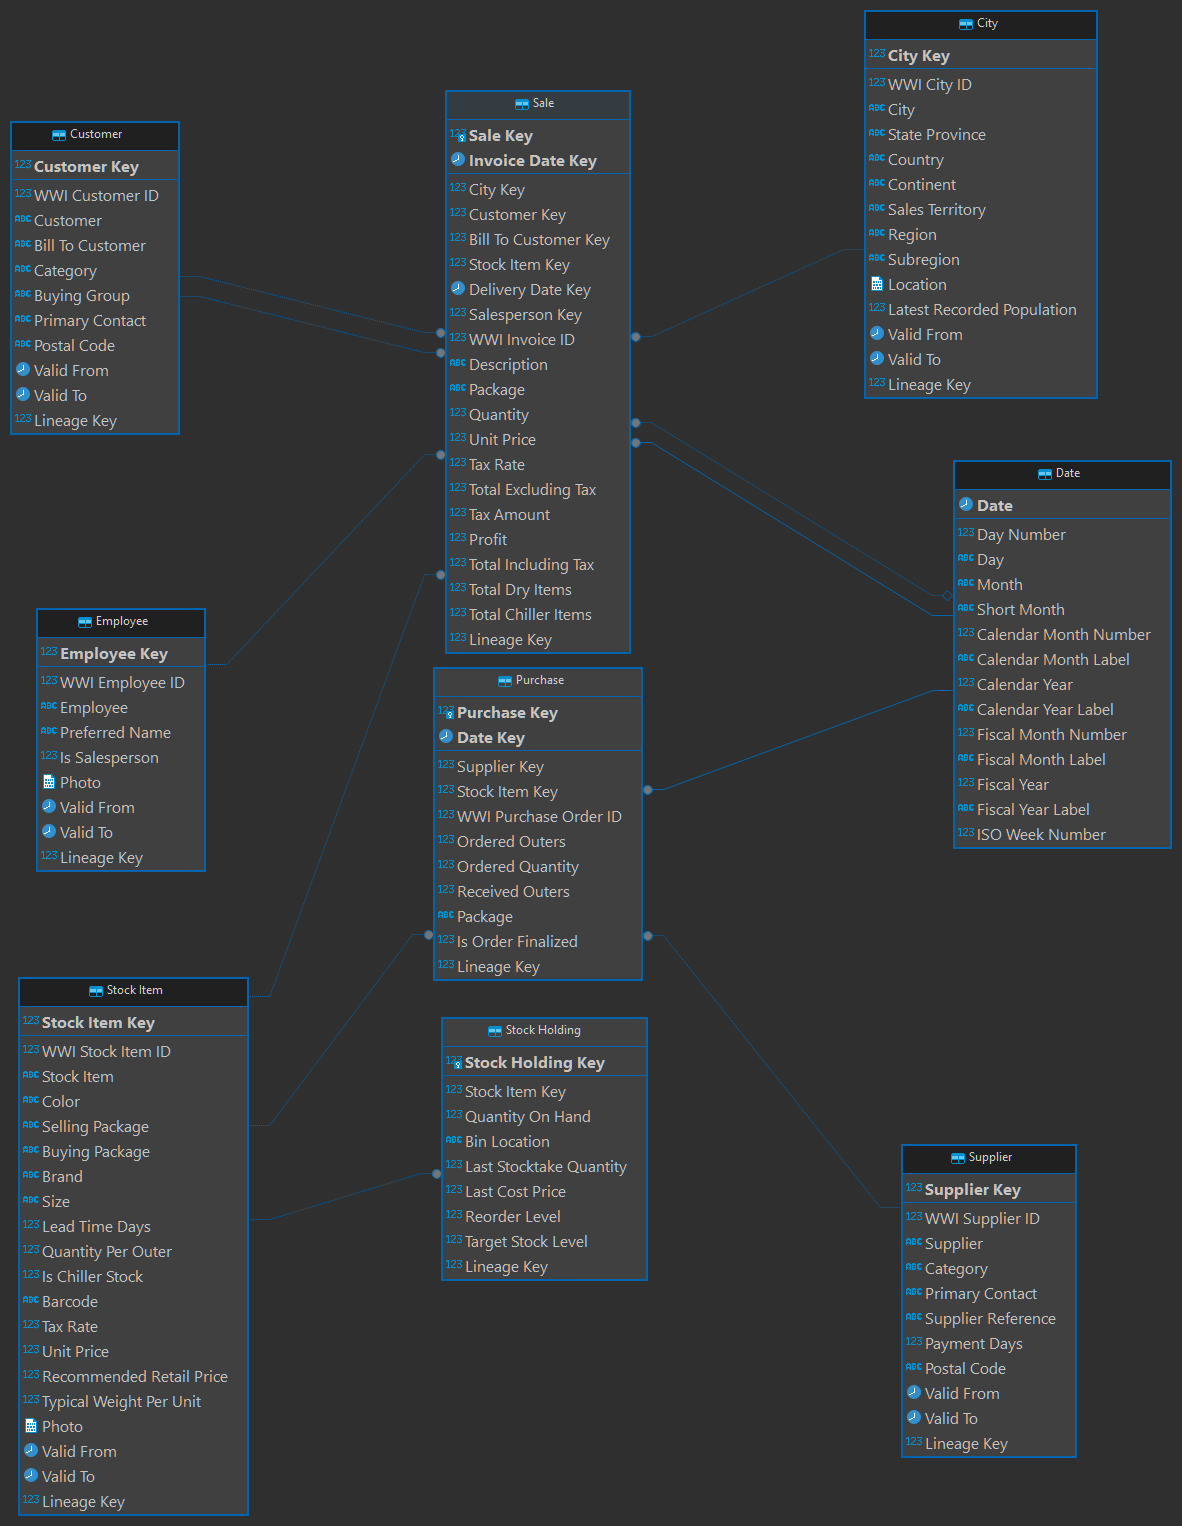
This project is composed of 3 main modules
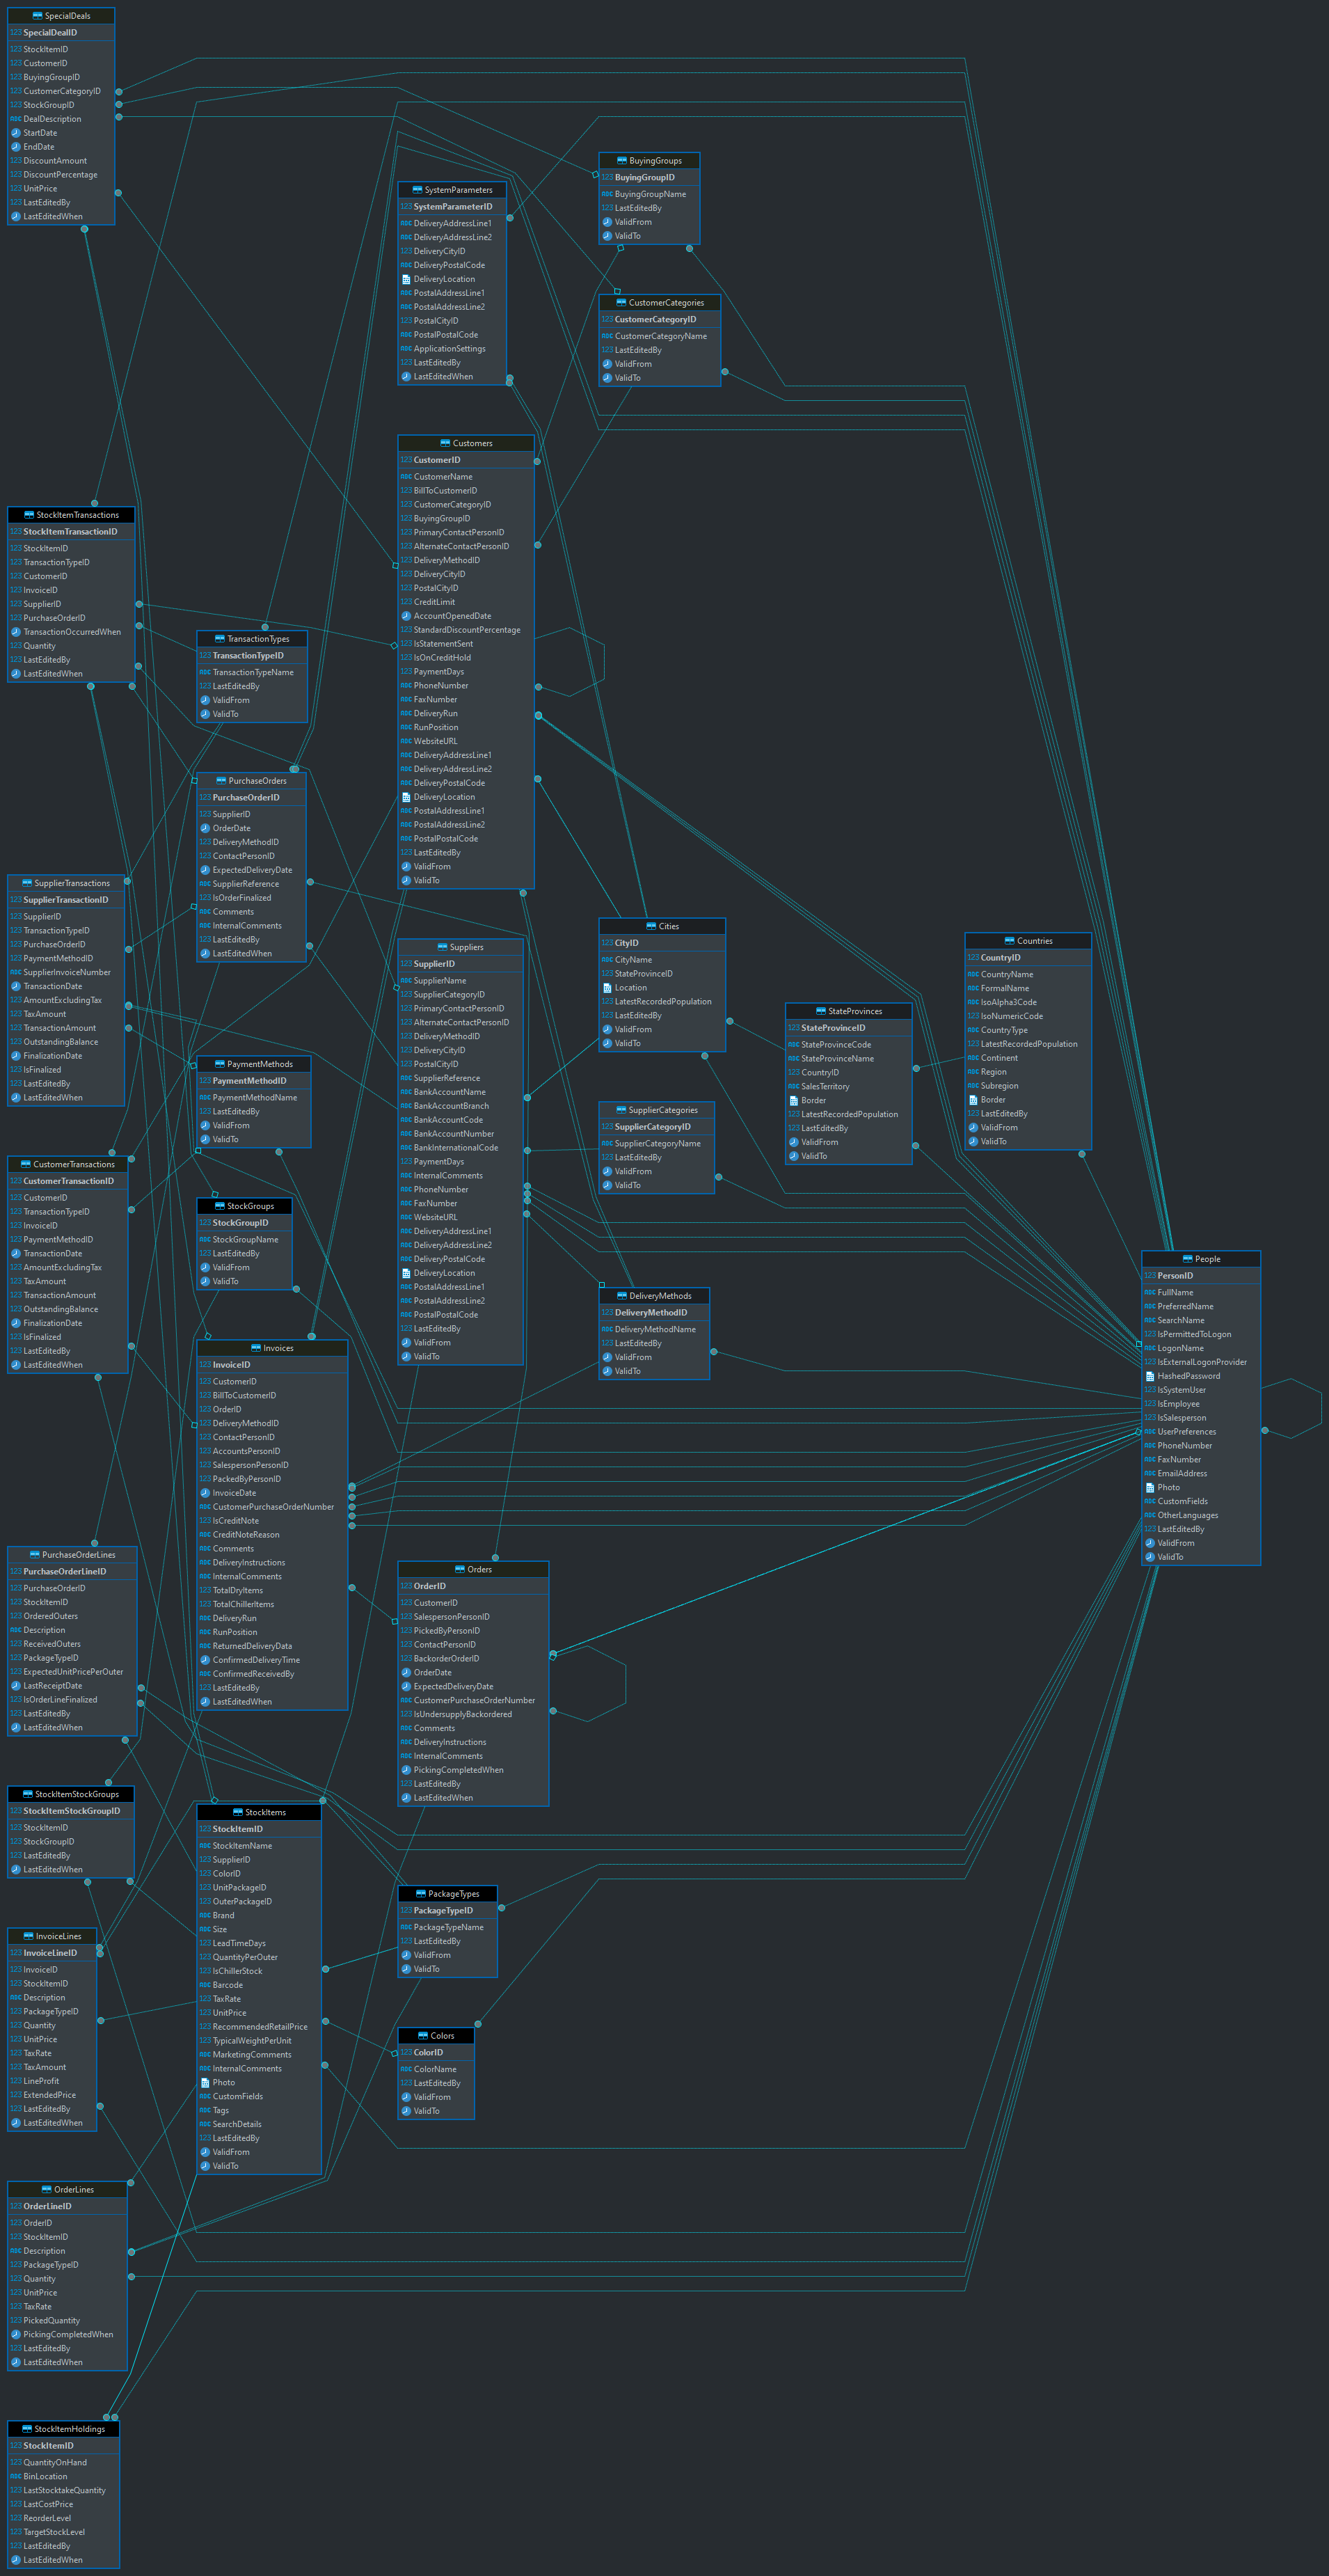
The data used for this project comes from the fictitious company Wide World Importers, by Microsoft.
Wide World Importers (WWI) is a wholesale novelty goods importer and distributor operating from the San Francisco bay area.
The typical flow for how items are stocked and distributed is as follows:
- WWI creates purchase orders and submits the orders to the suppliers.
- Suppliers send the items, WWI receives them and stocks them in their warehouse.
- Customers order items from WWI
- WWI fills the customer order with stock items in the warehouse, and when they don't have sufficient stock, they order the additional stock from the suppliers.
- Some customers don't want to wait for items that aren't in stock. If they order say five different stock items, and four are available, they want to receive the four items and backorder the remaining item. The item would then be sent later in a separate shipment.
- WWI invoices customers for the stock items, typically by converting the order to an invoice.
- Customers might order items that aren't in stock. These items are backordered.
- WWI delivers stock items to customers either via their own delivery vans, or via other couriers or freight methods.
- Customers pay invoices to WWI.
- Periodically, WWI pays suppliers for items that were on purchase orders. This is often sometime after they've received the goods.
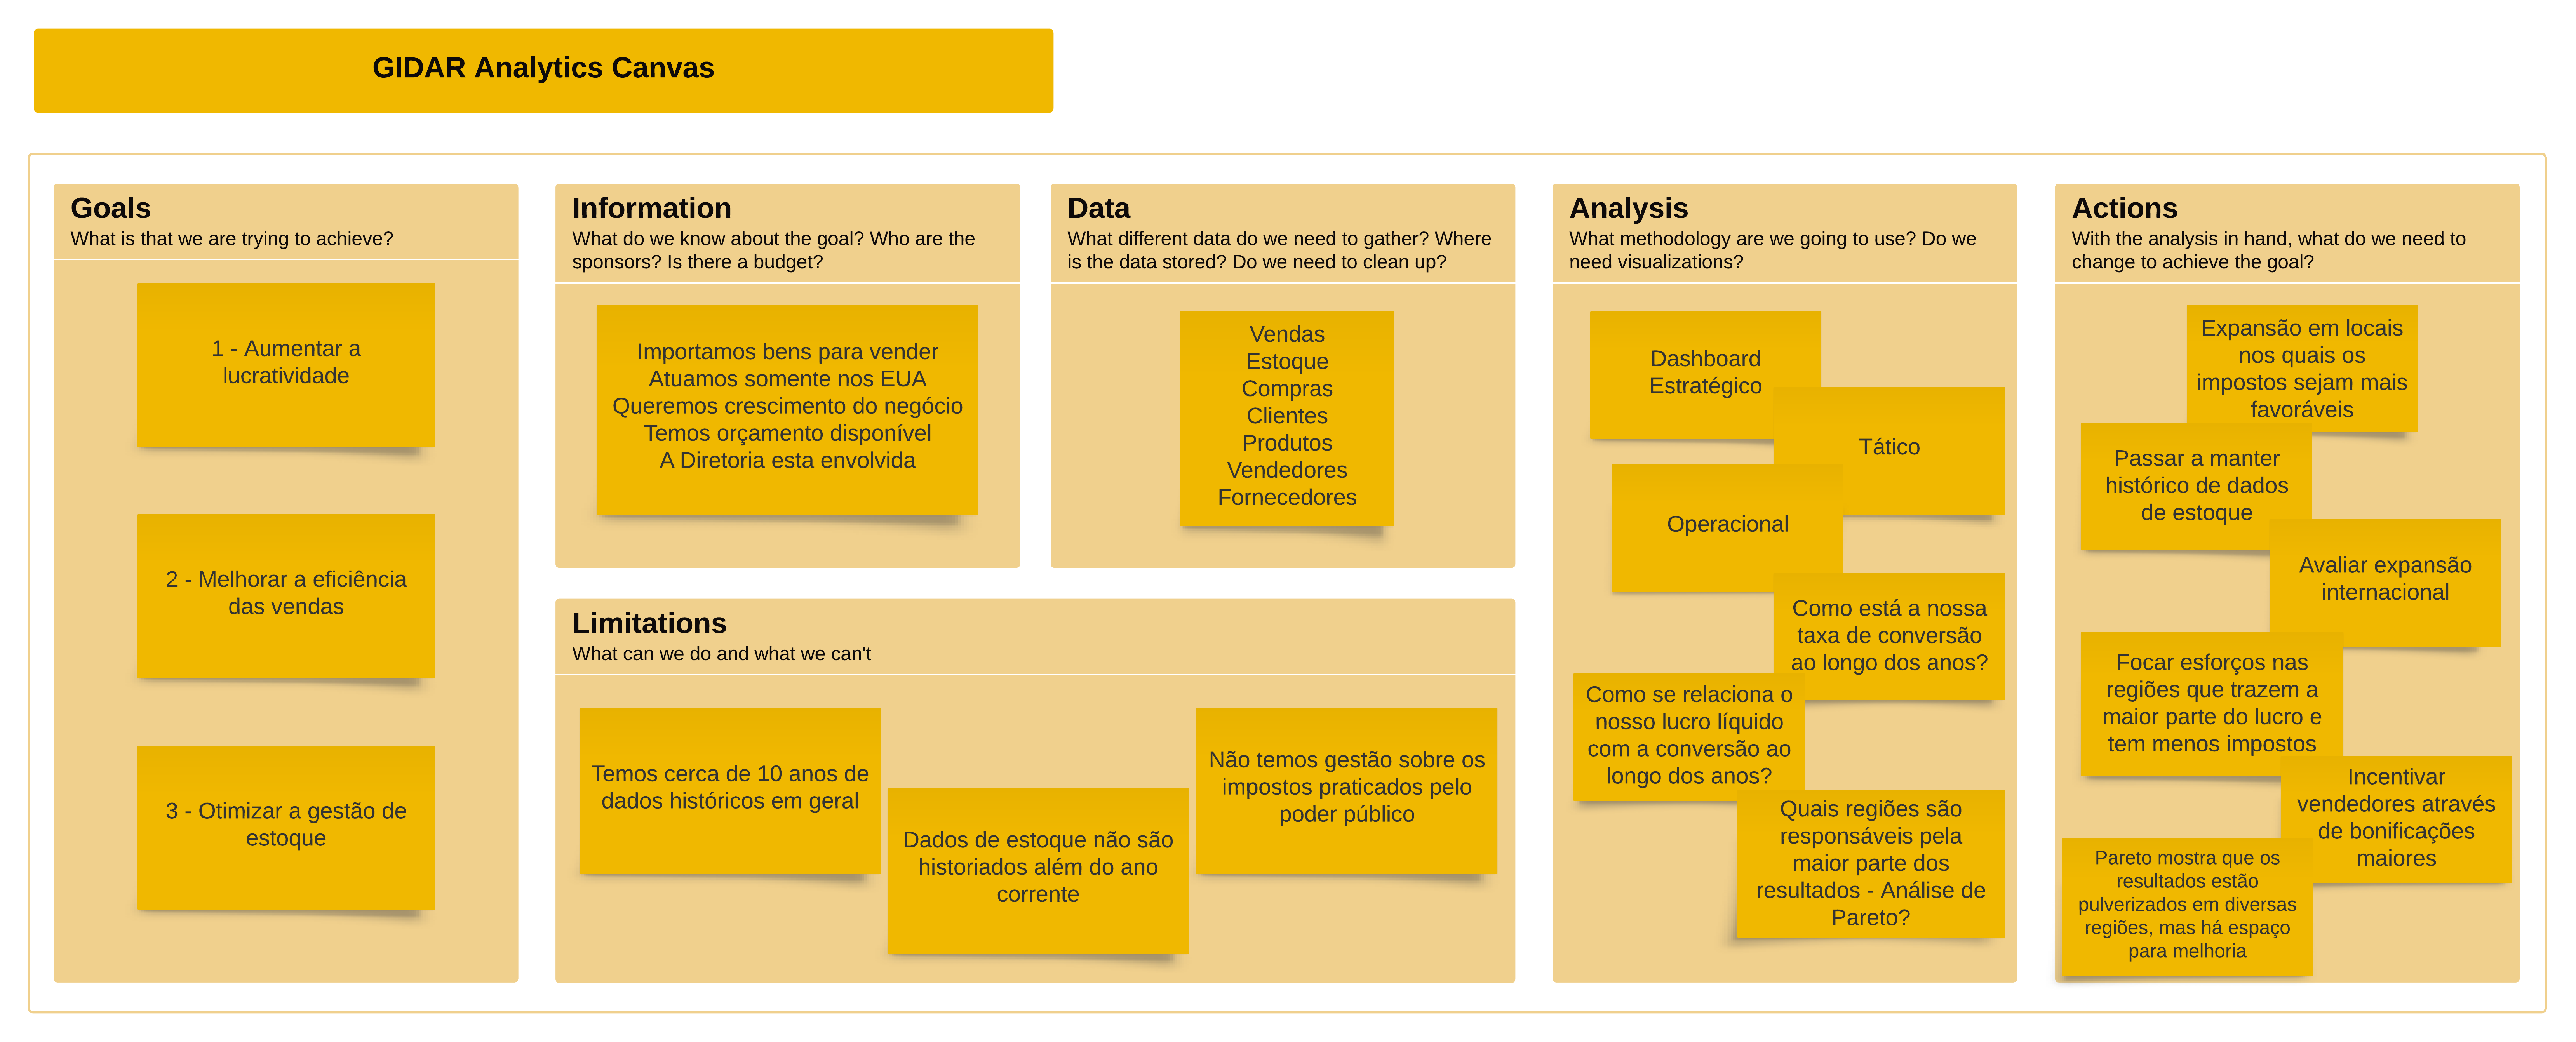
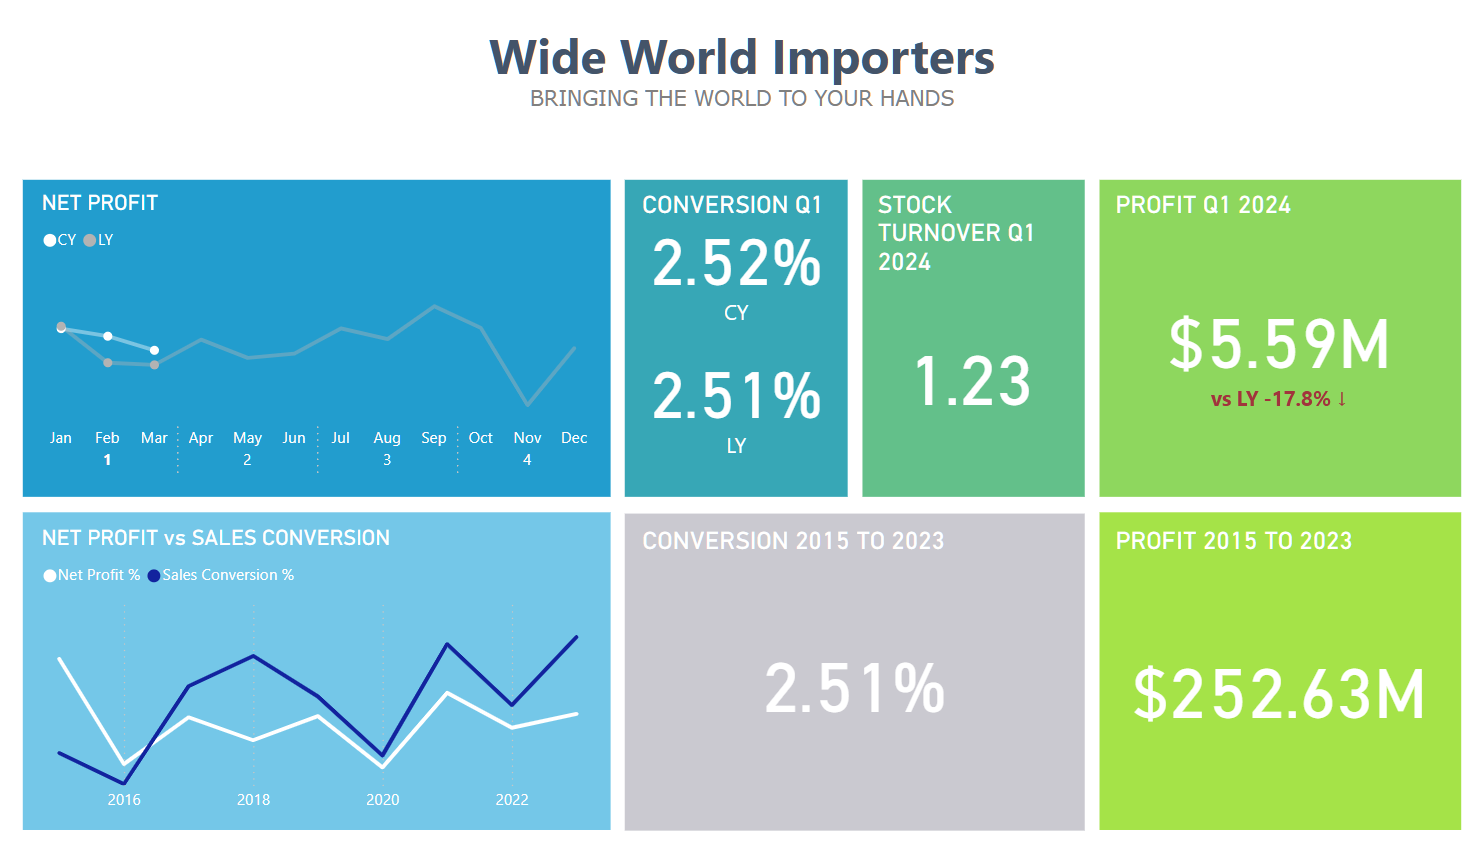
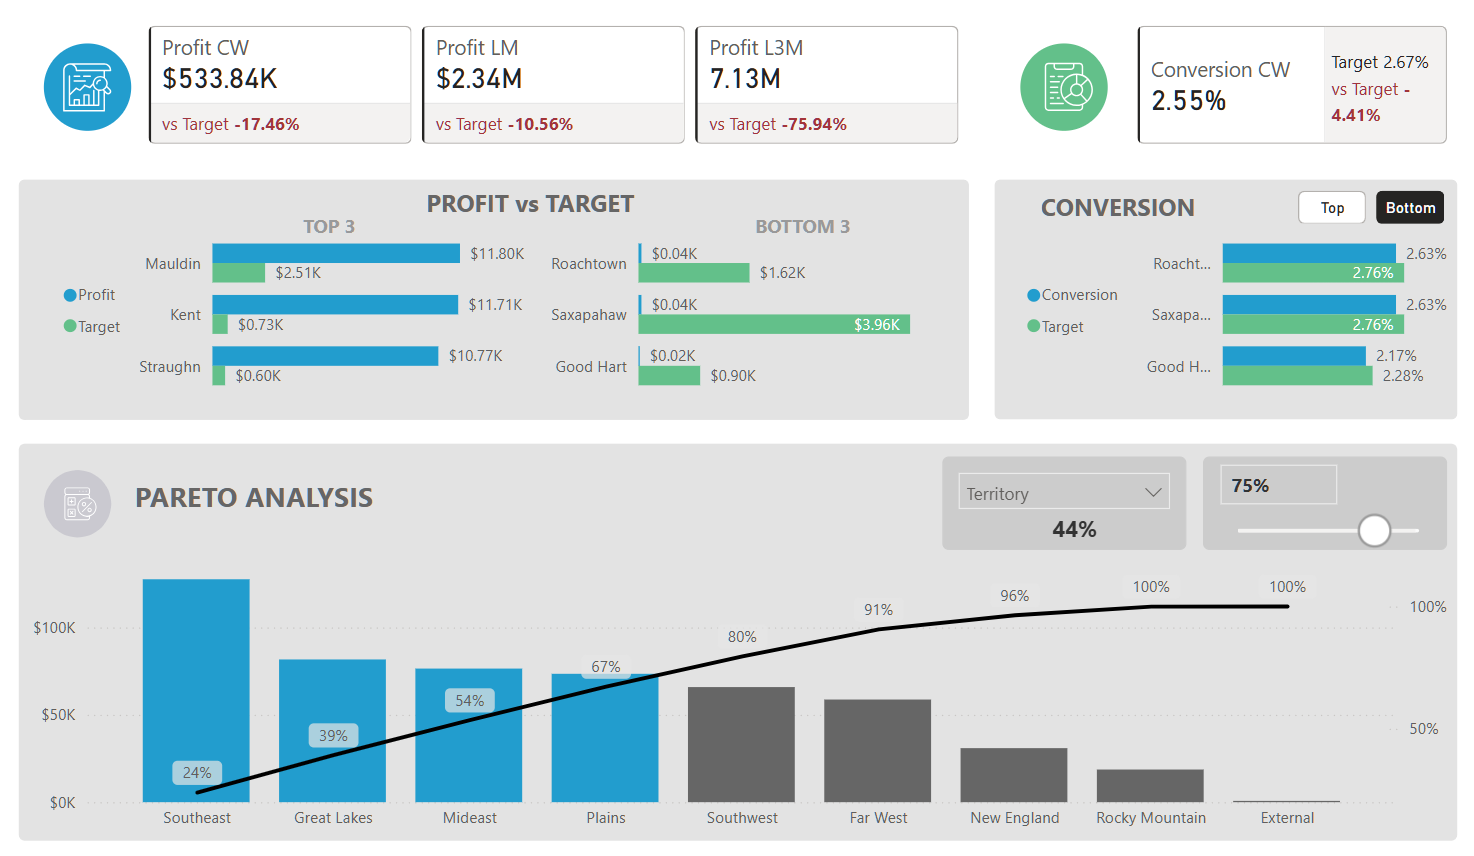
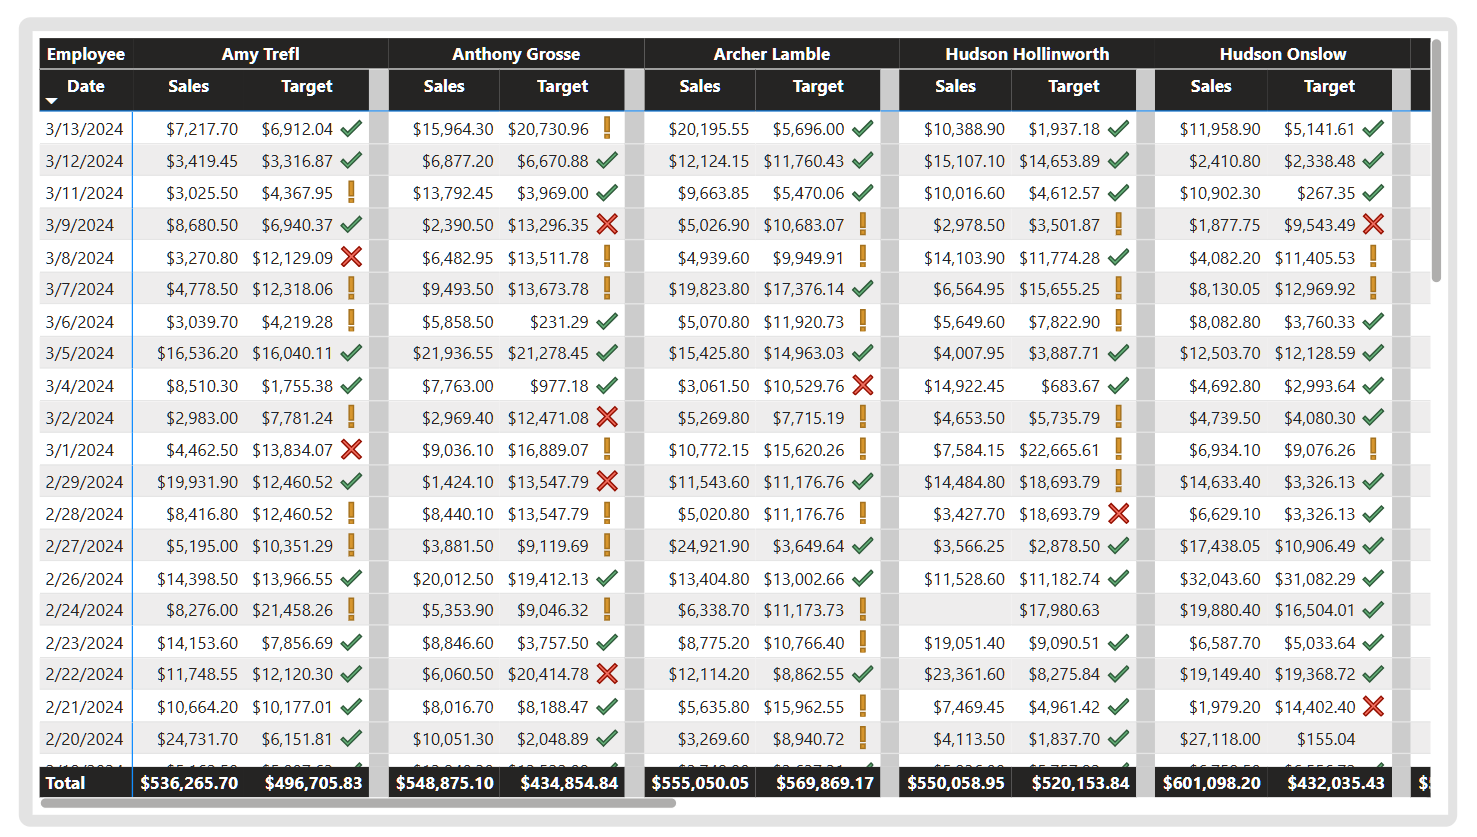
The strategic objectives stablished for this Project are:
- Increase company profit
- Improve sales efficiency
- Optimize inventory management
Click to access the interactive Dashboard
The focus of this module is to make advanced analysis with the aid of Machine Learning frameworks. Taking the strategic objective of increasing company's profit as fundament, we will try predict profit. The H2O Auto ML framework was used for this purpose.
H2O’s AutoML can be used for automating the machine learning workflow, which includes automatic training and tuning of many models.
The H2O AutoML is designed to have as few parameters as possible so that all the user needs to do is point to their dataset, identify the response column and optionally specify a time constraint or limit on the number of total models trained.
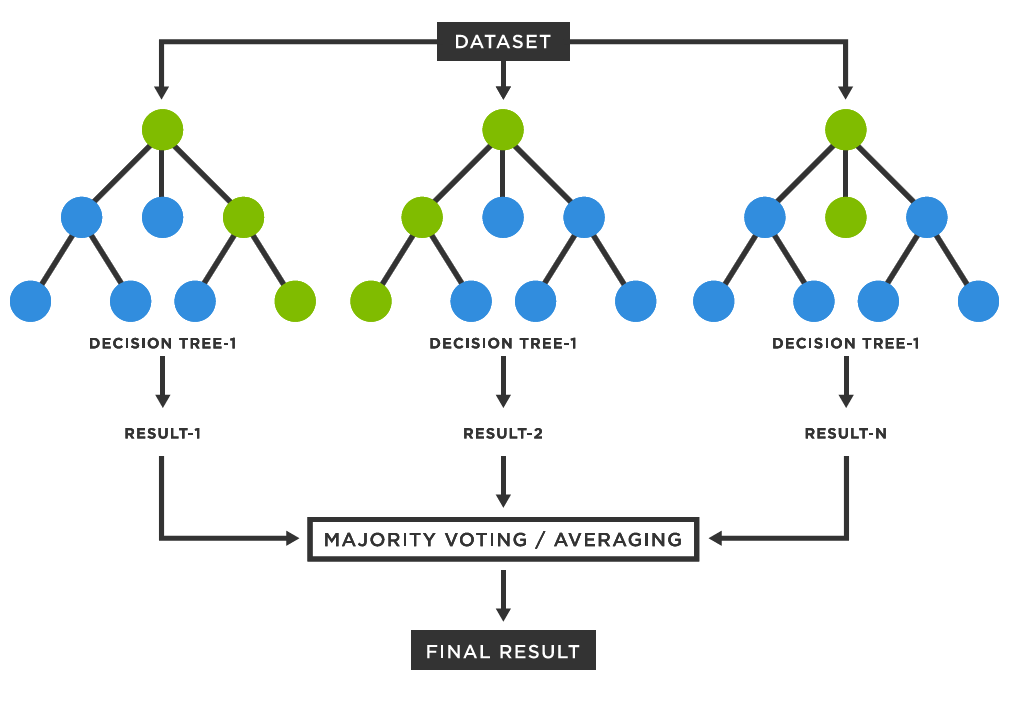
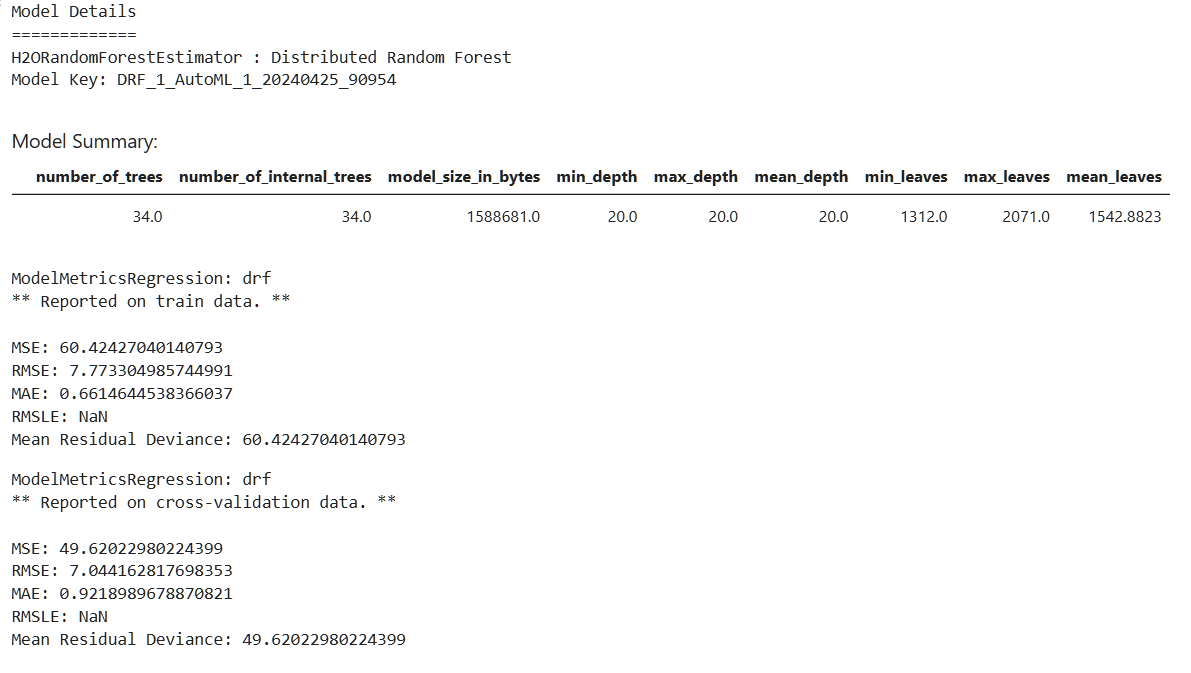
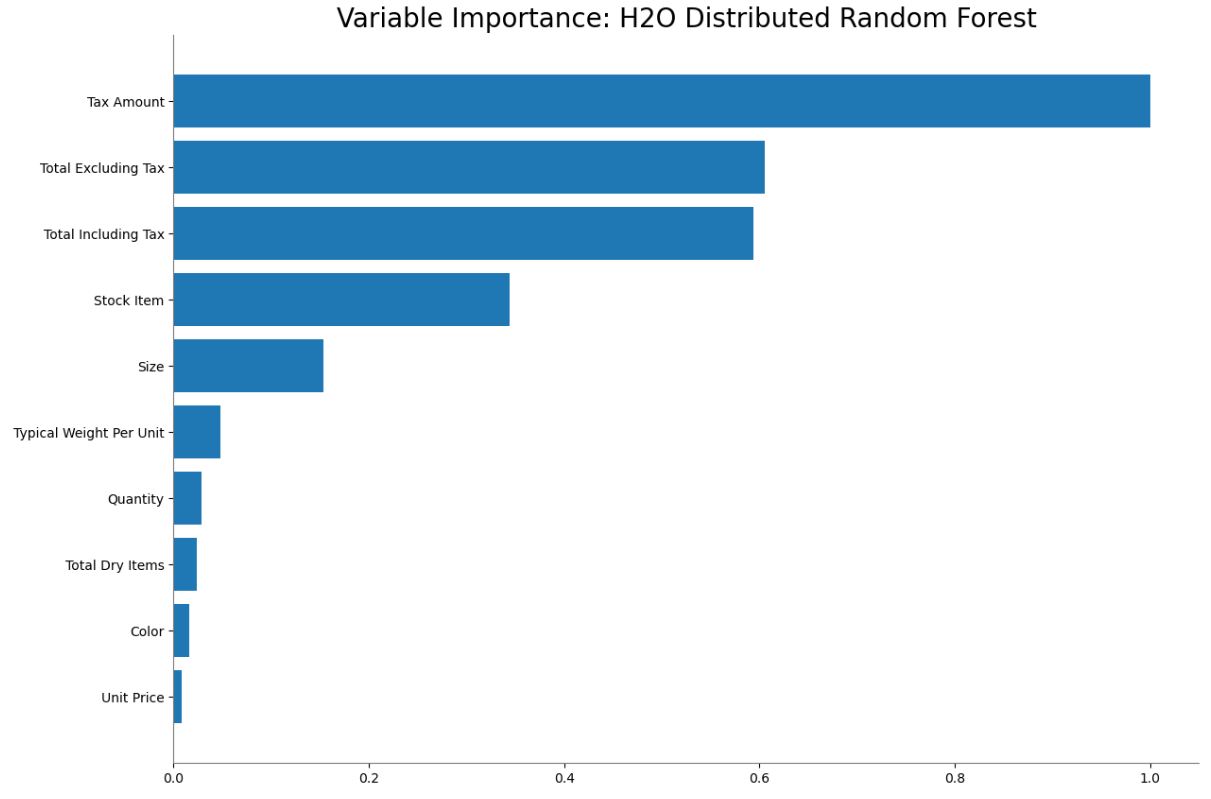
A Random Forest model was chosen for this regression task. Random forest is a commonly-used machine learning algorithm that combines the output of multiple decision trees to reach a single result. Its ease of use and flexibility have fueled its adoption, as it handles both classification and regression problems.
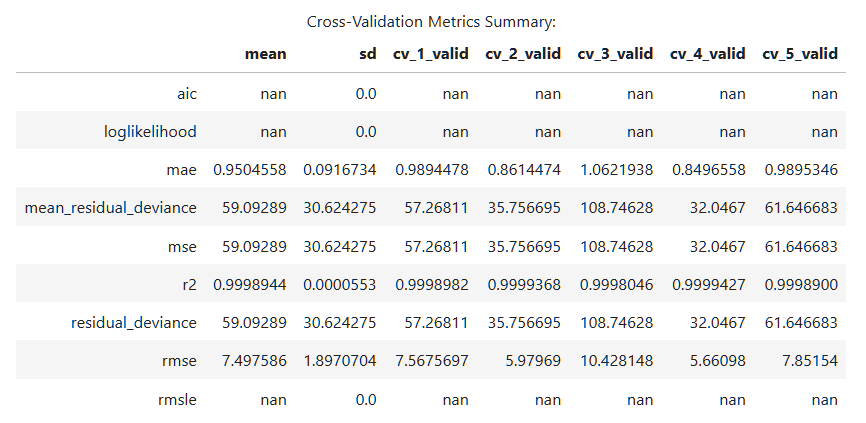
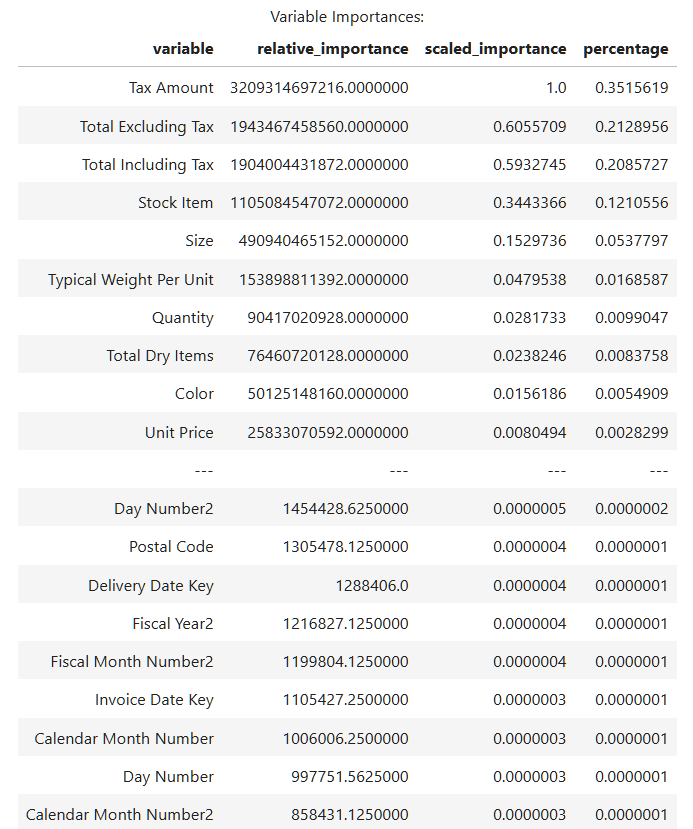
Below are the Model training result details.
