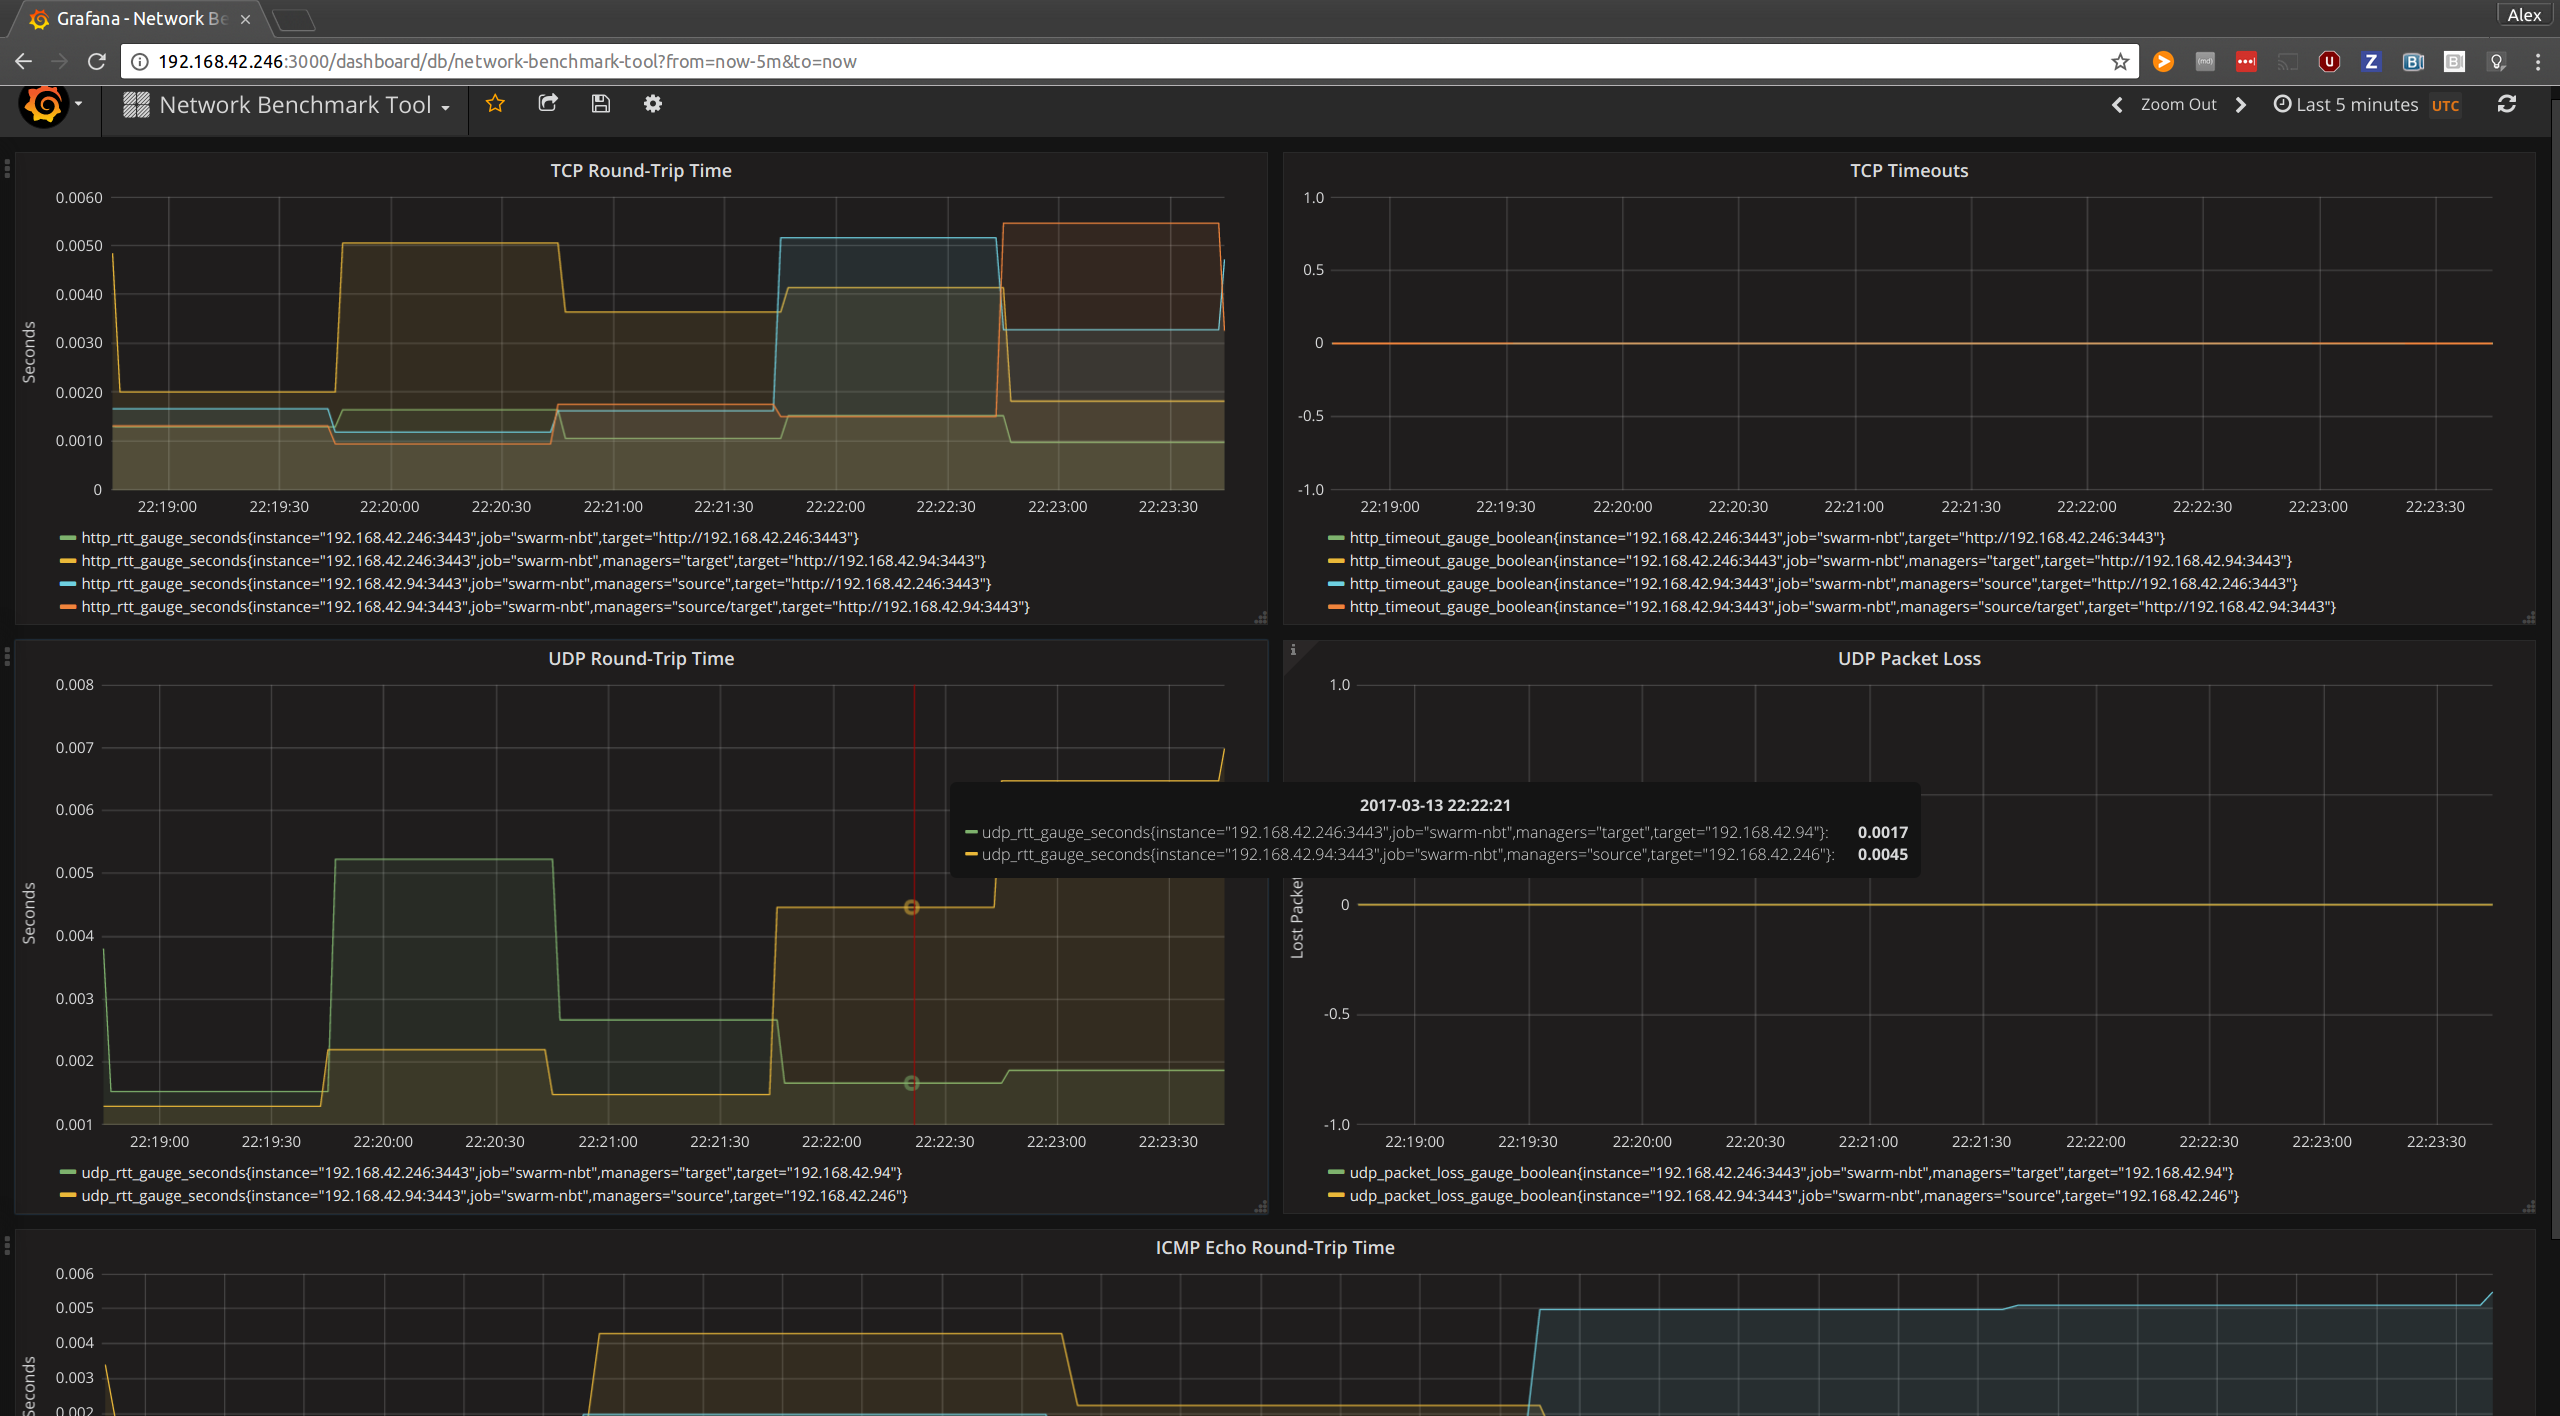
This tool measures the network quality of service across all nodes in a Swarm by capturing the following metrics over an extended time period:
- UDP and TCP round-trip delay time and packet loss
- ICMP Echo round-trip delay time
Individual measurements will be stored on a local volume on each node. When the benchmark operation is stopped, these measurements will be gathered on the tool runner container and processed into final results
To start the network benchmark tool,
-
Run the following command on a swarm manager node:
docker run --rm -v inventory:/inventory -v /var/run/docker.sock:/var/run/docker.sock alexmavr/swarm-nbt start -
Expose port 3000 on that manager and visit it through the browser. Username: admin, Password: admin
-
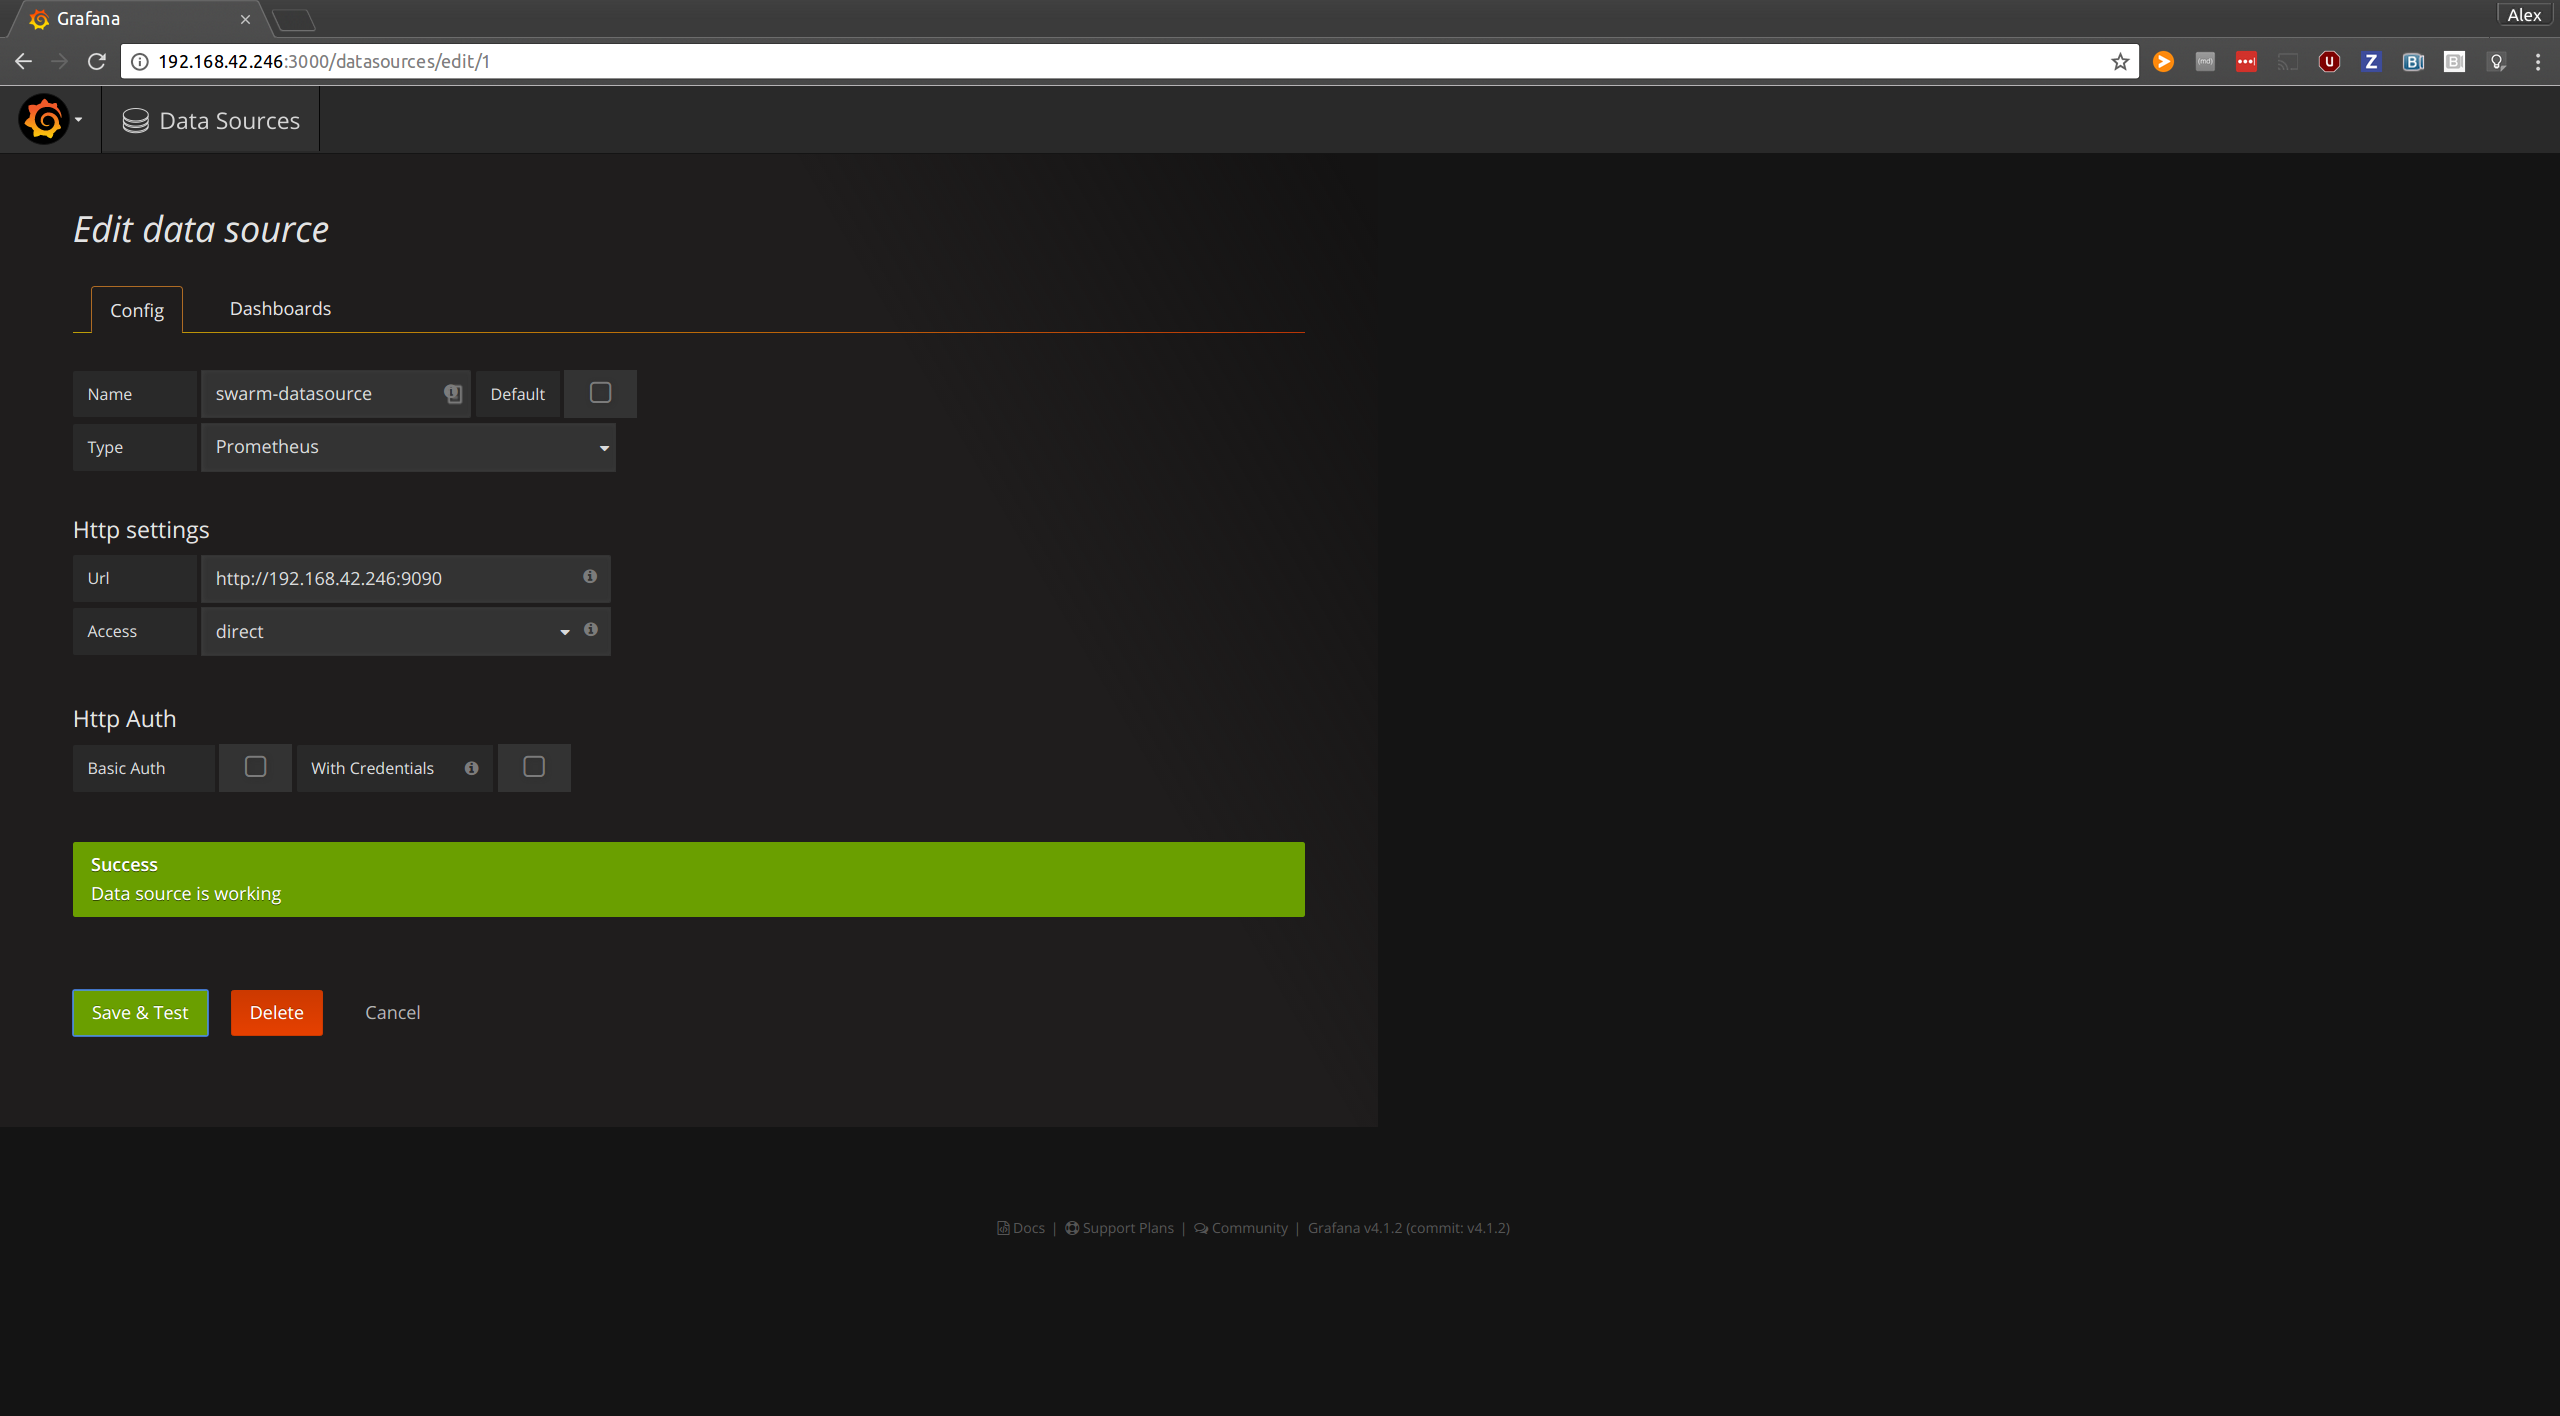
Click on the top-left menu and browse to Data Sources. Create a prometheus datasource with any name and point it to
http://<some-node-IP>:9090. Set access to "direct" and do not use any credentials:
- Click on the top-left menu, highlight "Dashboards" and select the "Import"
option. Import the grafana dashboard from the
grafana.jsonfile included in this repository. Use the prometheus datasource from step 3.
To stop the benchmark tool, run the following command on the initial swarm
manager node
docker run --rm -v /var/run/docker.sock:/var/run/docker.sock alexmavr/swarm-nbt stop
The benchmark tool starts a prometheus server service on port 9090 and a grafana service on port 3000 of all nodes in the cluster. The metrics can be viewed either directly on prometheus or using the graphana dashboard.
This tool can be ran when the local docker client is pointing to a Docker Swarm cluster rather than a single engine, such as Docker Universal Control Plane, with the following invocation:
- Start benchmark: This command will output a series of docker operations to be ran against the same shell
docker info | docker run -i -v inventory:/inventory --rm alexmavr/swarm-nbt start --compat
- Stop benchmark:
docker info | docker run -i --rm alexmavr/swarm-nbt stop --compat

