Machine Learning Course - Final Project
Firstly we load the data from their respective folder paths and store them in 2D arrays:
→ index[0] corresponds to the image array.
→ index[1] corresponds to the label of said image.
→ label = 0 corresponds to the "Pneumonia" class.
→ label = 1 corresponds to the "Normal" class.
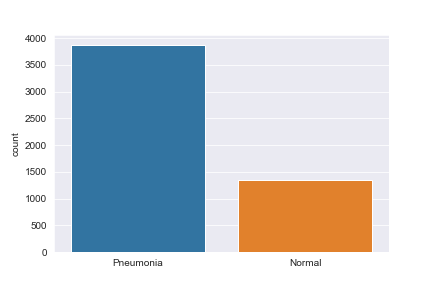
Secondly we make a simple plot to take a look at its distribution

We can notice that the data is fairly biased to Pneumonia. This means a few things:
- Results will inevitably be biased to Pneumonia.
- Overfitting will eventually occur.
- Data manipulation is very needed for this data.
This can be solved in few ways:
- Cutting the
Pneumoniadata to be equal to theNormaldata.This isn't a viable option since the data quantity is already small.
- Performing data augmentation on the
Normaldata to be equal to thePneumoniadata.Logically this seems like a good option, but may result in some overfitting to the available
Normalfeatures.
Since our data is of type image, the data augmentation methods need to fit the image criteria:

- Augmentor → time consuming + high cpu usage
- Albumentations → used
- Imgaug → high cpu usage
- AutoAugment (DeepAugment) → errors in importing dependencies

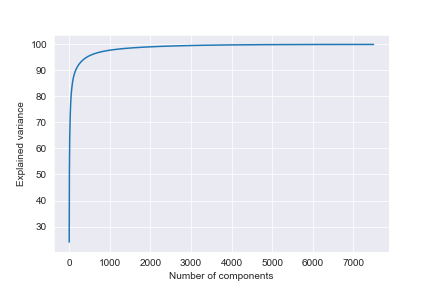
According to the cumulative sum plot of the obtained PCA components, we can see that the variance is almost a constant straight line after roughly 1500 components.
We picked PCA(n_components = 1000)
Scores were as follows:
- train score = 98.4%
- test score = 80.0%
Scores were as follows:
- train score = 98.4%
- test score = 78.0%
-
svm classifier:
- train score = 98.11%
- test score = 78.37%
-
logistic regression:
- train score = 97.10%
- test score = 74.68%
-
KNN classifier:
- train score = 96.01%
- test score = 76.60%
-
ensemble learning 1.0:
- train score = 99.25%
- test score = 77.56%
-
ensemble learning 2.0 with gradient boosting:
- train score = 98.66%
- test score = 75.80%
Basic machine learning algorithms in this field are considered outdated given the huge advancements in the field of artificial intelligence. Deep learning models should prove more helpful in such cases.