/D3-challenge_American-s-Healthcare-Income-

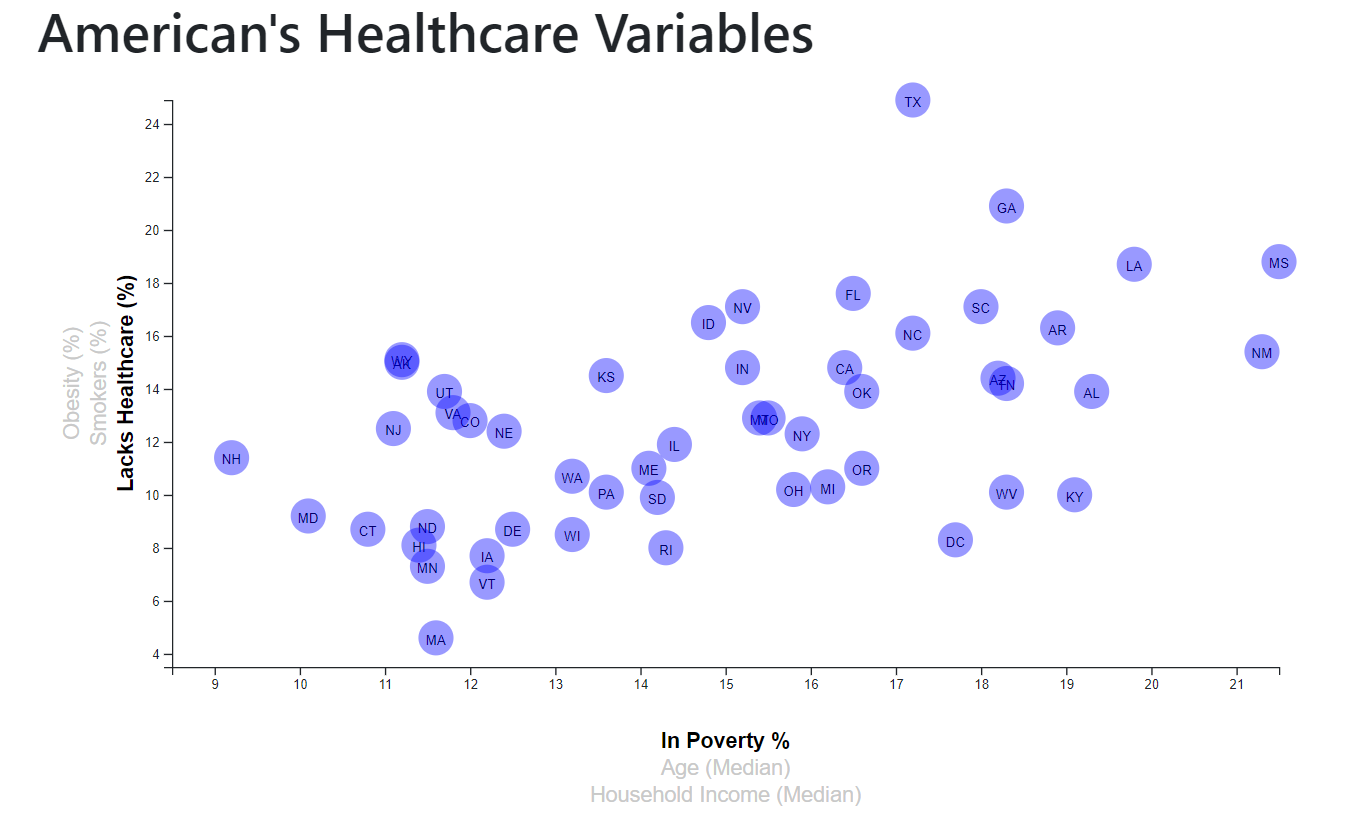
Using a HTML, a scatter plot of Healthcare vs. Poverty is displayed including state abbreviations, locating axes to the chart left and bottom and using localhost 8000. I also used tooltips as added values. As a Bonus, to “impress my Boss”, I prepared an interactive scatter plotter chart that shows how Obesity, Smokers and Lack of Healthcare vary regarding Poverty, Age and Income.

Primary LanguageJavaScript

D3-challenge

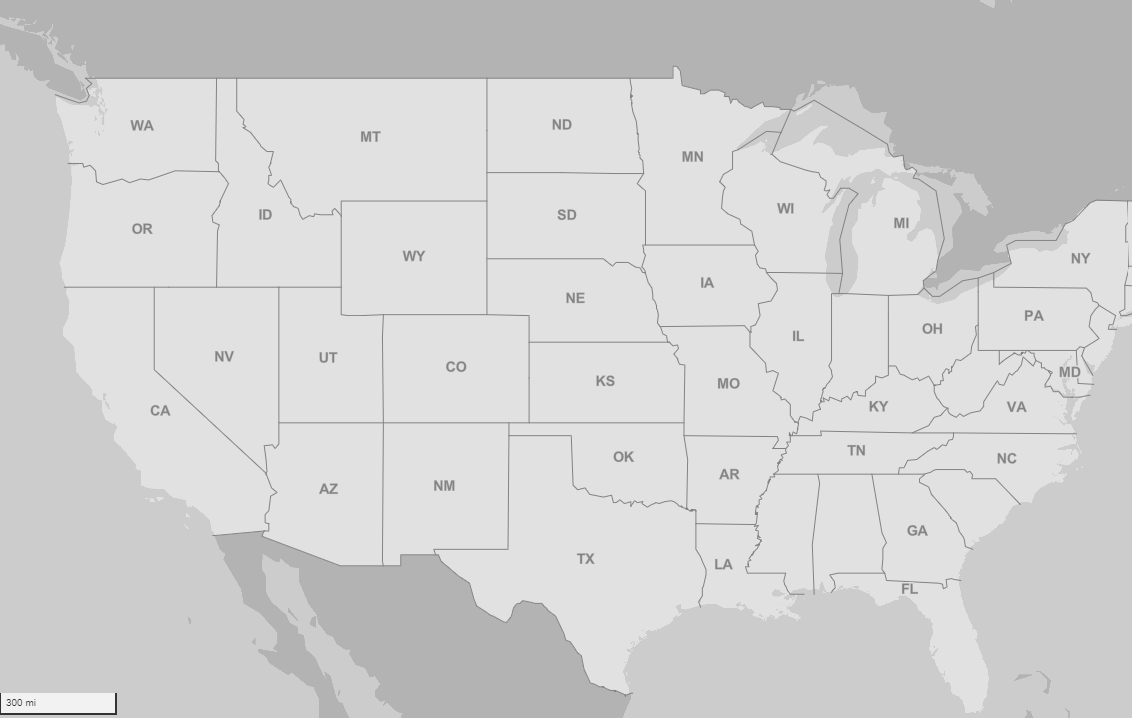
US_Map.png

D3 Dabbler - Required Assignment

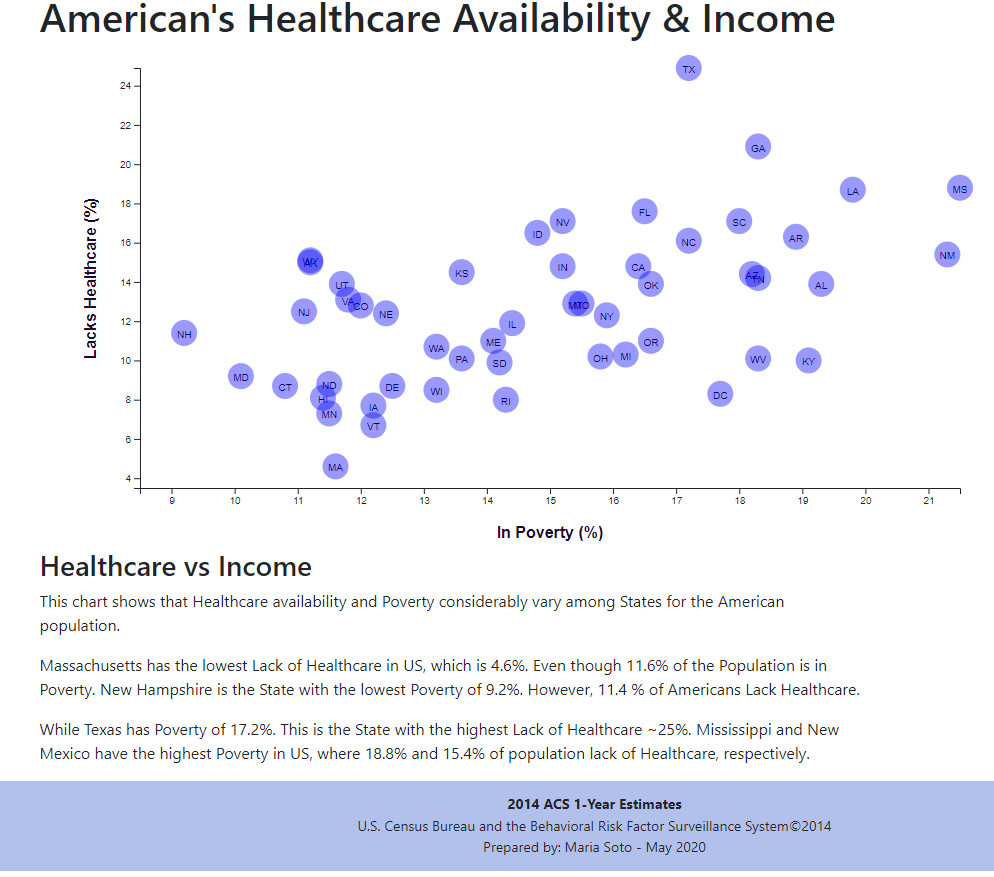
In this project I created a scatter plot of Healthcare vs. Poverty, including state abbreviations, locating axes to the chart left and bottom and using localhost 8000.

I additionally used toolTips as added values when pointing the mouse on the State circles. I had issues with this part, but I sorted them out. This is an updated version of the assisgnment, where I am also including the Bonus.

D3 Bonus: Impress the Boss (Optional Assignment)

I prepared an interactive scatter plotter chart that shows how Obesity, Smokers and Lack of Healthcare vary regarding Poverty, Age and Income. Tooltips were also included in this activity.
Data sources

Screenshots from the Scatter Plot

scatter_plott_req.png

scatter_plott_bonus.png