Frequency Encoder
Encoder design
The FrequencyEncoder encodes a time series chunk (or any 1D array of numeric
values) by taking the power spectrum of the signal and discretizing it. The
discretization is done by slicing the frequency axis of the power spectrum in
bins. The parameter controlling the number of frequency bins is
numFrequencyBins. The maximum amplitude of the power spectrum in this
frequency bin is encoded by a ScalarEncoder. The parameter in
FrequencyEncoder controlling the frequency bin size is freqBinN,
which sets the parameter n of ScalarEncoder. The parameter in
FrequencyEncoder controlling the resolution (width) of a bin size is
freqBinW, which sets the parameter w of ScalarEncoder.
Here is an example with a combination of sine waves where
numFrequencyBins=8, freqBinN=8 and freqBinW=1 :
Parameter tweaking
To increase the resolution of the frequency encoding, increase the values
of numFrequencyBins and freqBinN. To increase the robustness to noise
for each frequency bin, increase the value of freqBinW. Here is
an example with a phoneme where numFrequencyBins=32, freqBinN=32 and
freqBinW=3.
Usage
import numpy as np
from frequency_encoder import FrequencyEncoder

# Example input to encode
chunk = np.array([1.0, 2.0, 1.0, 1.0])

# Encoder params
numFrequencyBins = 8
freqBinN = 8
freqBinW = 1

# Encoding
encoder = FrequencyEncoder(numFrequencyBins, freqBinN, freqBinW)
encoding = encoder.encode(chunk)

# Plot encoding (optional)
import matplotlib.pyplot as plt
plt.imshow(encoding.reshape(numFrequencyBins, freqBinN))
Note:
The
FrequencyEncodertakes 2 optional parameters as input:minvalandmaxval. These are used to set the min and max value of theScalarEncoderused to encode the values of the the power spectrum density (PSD) in eachfrequencyBin. In the next section we present some analysis results where we show that, if you take the log of the power spectrum, the default settingsminval=0.0andmaxval=14.0work well for most sounds. Finally, there is an additional param inFrequencyEncoderwhich is calledlogthat allows you to not take the log of the power spectrum. By default,log=Trueand we don't recommend to set it toFalsesince it makes it hard to find amaxvalvalue that works well for a variety of sounds.
Power spectrum analysis
Credit: Thomas Miconi
To use ScalarEncoder on the power spectrum of unpredictable sound chunks, we
need an estimate of the maximum possible value that will occur in any of
these power spectra.
The exact values of the power spectrum depends on several parameters, including the size of the time chunk and the sampling frequency. For all phonemes used in the Phoneme data set from UCR, sampling frequency is (roughly) 22050 Hz, so we ignore this. This leaves the question of how max(power) varies with size of time chunk.
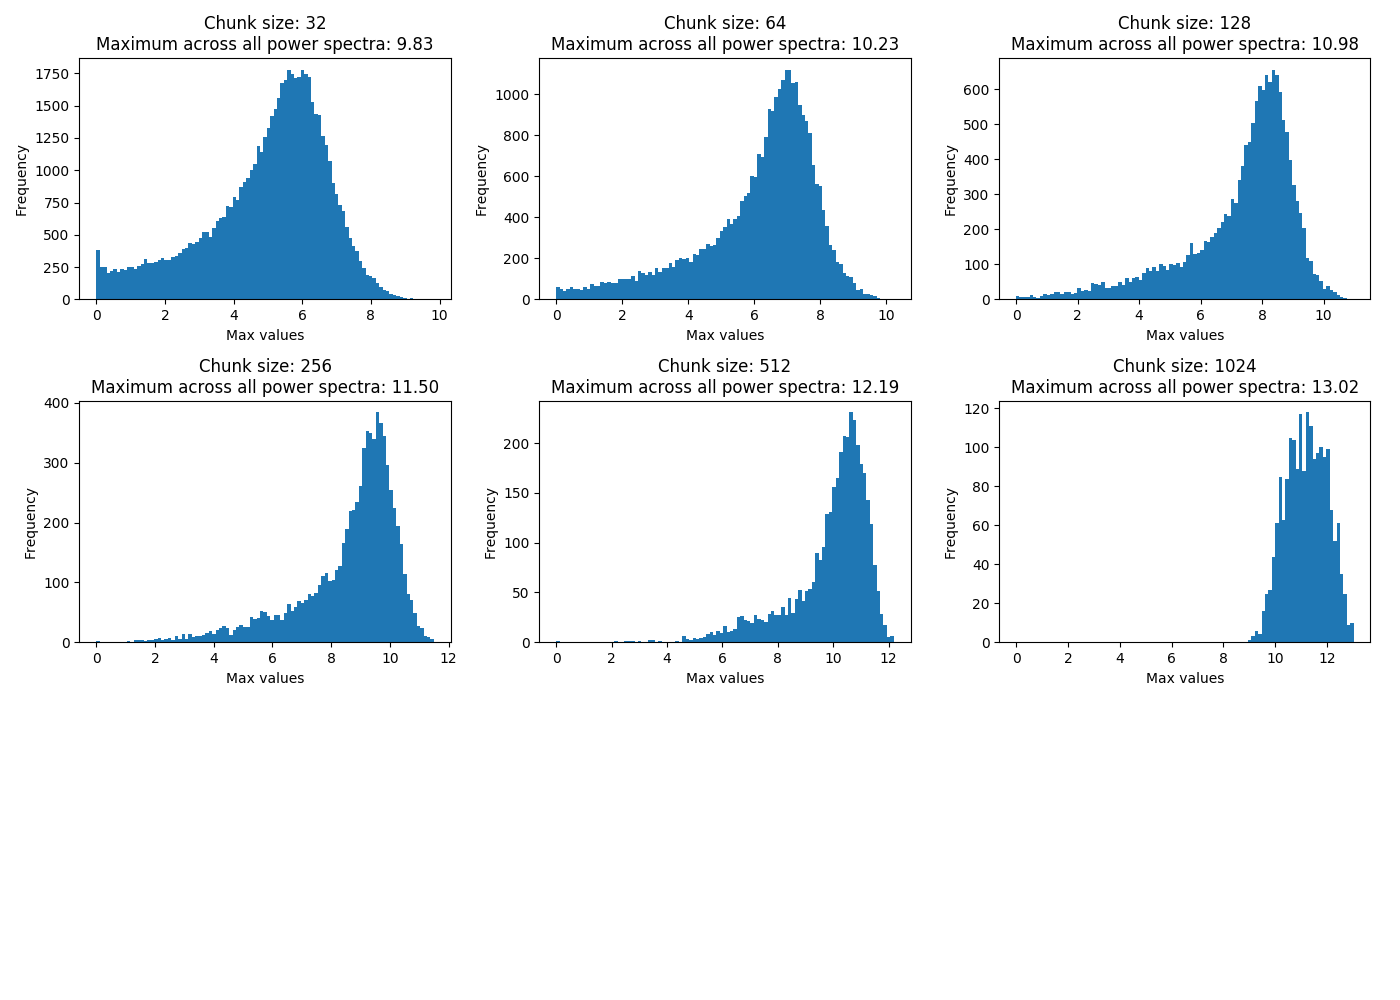
We simply run through several plausible values of the chunk size, from 32 to 1024 (the phonemes all have size 1024 samples).
Perhaps unsurprisingly, the maximum value of the raw power spectrum varies grows with time chunk size. In addition, it is badly distributed: long tail and high density near zero.
Both problems are solved by taking the log of the power, which is also biologically defensible. Now max power never goes beyond 14, with a nice bell-curve shape (not sure it's Gaussian) centered around values ranging from 6 to 10.
Script to reproduce the results: plot_max_power_histograms.py.


