Utility for copying files from one dir to another, useful for sfdx. More here
If you've worked on integrating third party APIs with Salesforce, you'll know that there are different URLs for non-prod vs prod. In your dev environment, you may even point to mocks. If these URLs are stored in named credentials/custom metadata, you won't be able to deploy them without having a way of changing them based on the environment you are going to deploy to.
A sample solution might include a separate config directory that has dev, prod sub-directories, in which the custom metadata exists specific to that environment. These can then be copied into the src or force-app/main/default directories as necessary before deployment.
This utility supports solutions such solutions.
NPM module not yet published!! So you may fork the repo and then publish it yourself. Please use a different name to copyutil.
Following content is generated by default using the sfdx plugins:generate command:
$ npm install -g sfdx-copy-files-plugin
$ sfdx COMMAND
running command...
$ sfdx (-v|--version|version)
sfdx-copy-files-plugin/0.0.1 darwin-x64 node-v13.5.0
$ sfdx --help [COMMAND]
USAGE
  $ sfdx COMMAND
...
If you've published such similar package to npm, you may use it the following way:
sfdx copyutil:copy-files [-s <string>] [-t <string>][--json] [--loglevel trace|debug|info|warn|error|fatal|TRACE|DEBUG|INFO|WARN|ERROR|FATAL]
copy and replace files from source (-s) to target (-t) directory
USAGE
  $ sfdx copyutil:copy-files [-s <string>] [-t <string>] [--json] [--loglevel
  trace|debug|info|warn|error|fatal|TRACE|DEBUG|INFO|WARN|ERROR|FATAL]

OPTIONS
  -s, --sourcedir=path/to/source                                                                   path to source directory relative to current path

  -t, --targetdir=path/to/target                                               path to source directory relative to current path

  --json                                                                            format output as json

  --loglevel=(trace|debug|info|warn|error|fatal|TRACE|DEBUG|INFO|WARN|ERROR|FATAL)  [default: warn] logging level for
                                                                                    this command invocation

EXAMPLES
  $ sfdx copyutil:copy-files --sourcedir config/namedCredentials --targetdir force-app/main/default/namedCredentials
     Copying files from config/namedCredentials to force-app/main/default/namedCredentials
     Copying a.namedCredential...
     Copying b.namedCredential...
     Copied 2 files
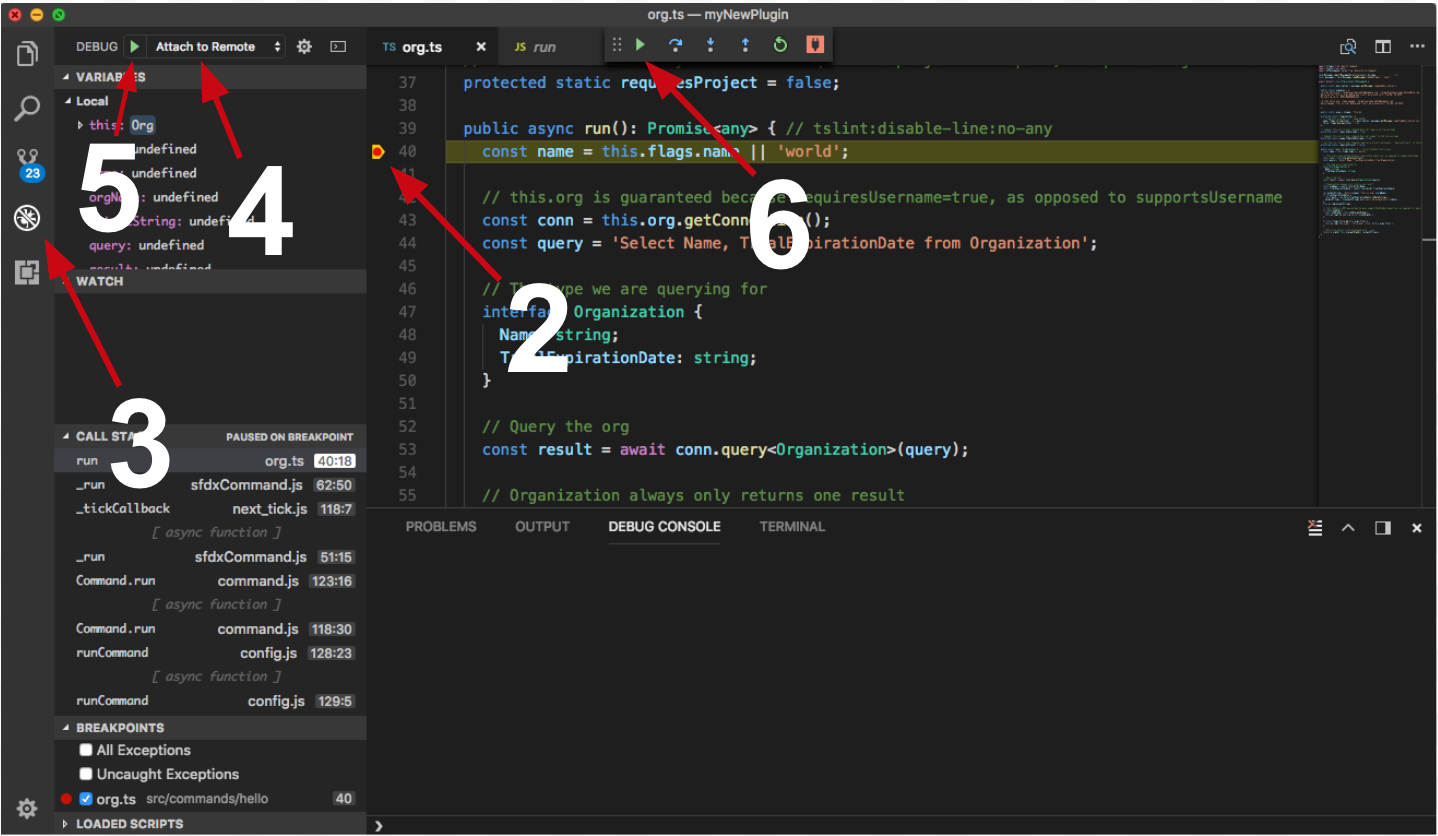
We recommend using the Visual Studio Code (VS Code) IDE for your plugin development. Included in the .vscode directory of this plugin is a launch.json config file, which allows you to attach a debugger to the node process when running your commands.
To debug the copyutil:copy-files command:
- Start the inspector
If you linked your plugin to the sfdx cli, call your command with the dev-suspend switch:
$ sfdx copyutil:copy-files -s config/namedCredentials -t force-app/main/default/namedCredentials --dev-suspendAlternatively, to call your command using the bin/run script, set the NODE_OPTIONS environment variable to --inspect-brk when starting the debugger:
$ NODE_OPTIONS=--inspect-brk bin/run copyutil:copy-files -s config/namedCredentials -t force-app/main/default/namedCredentials- Set some breakpoints in your command code
- Click on the Debug icon in the Activity Bar on the side of VS Code to open up the Debug view.
- In the upper left hand corner of VS Code, verify that the "Attach to Remote" launch configuration has been chosen.
- Hit the green play button to the left of the "Attach to Remote" launch configuration window. The debugger should now be suspended on the first line of the program.
- Hit the green play button at the top middle of VS Code (this play button will be to the right of the play button that you clicked in step #5).

Congrats, you are debugging!


