Proof of concept for monitoring and alerting on metrics from your Obsidian Vault1
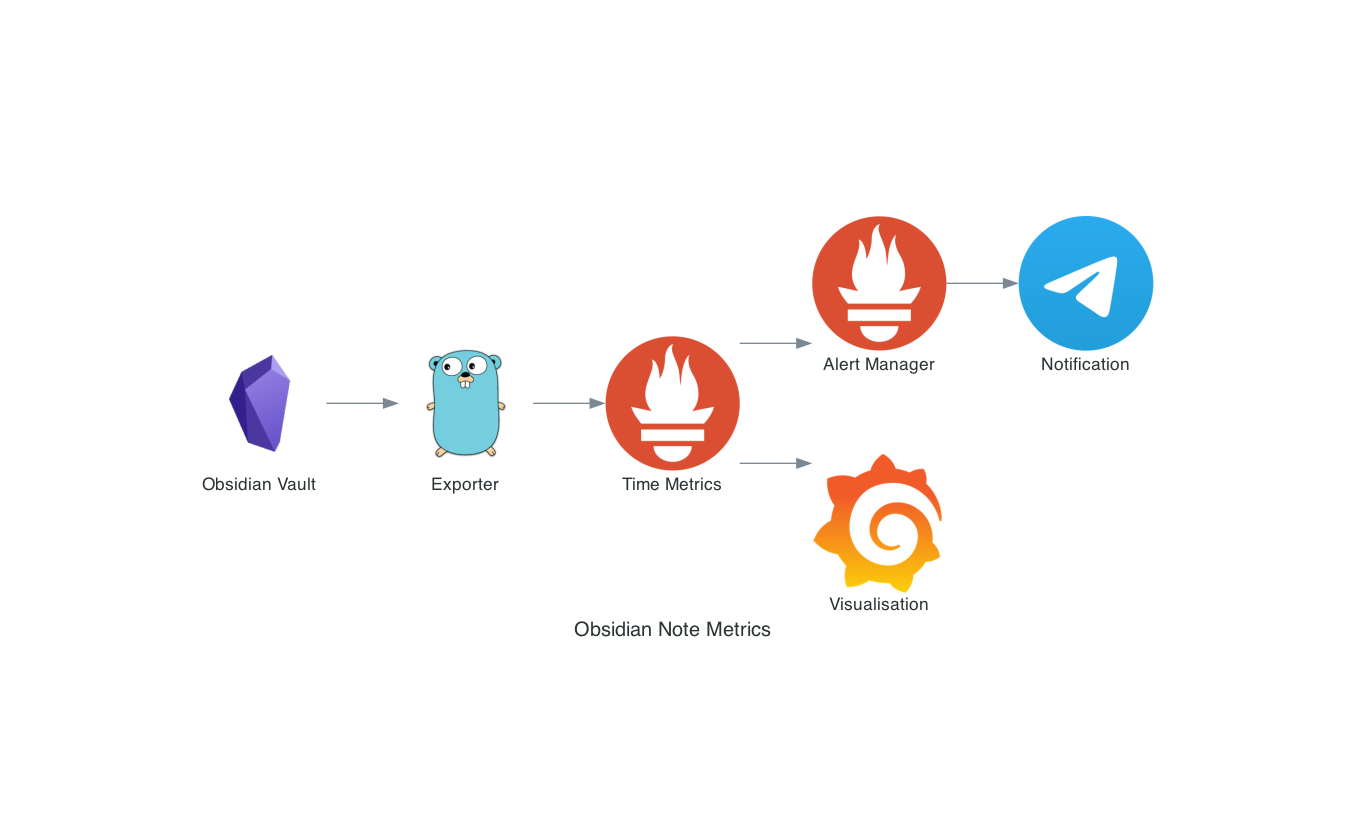
The exporter looks for a particular tag in your markdown files and exposes that as a prometheus gauge.
This can then be consumed by prometheus, visualised with grafana and notifications provided by alert manager.
The example uses telegram for notifications but it would be easy enough to use another notification method.
This repository uses Taskfile as a build helper. Run task -l to see available tasks.
Using Taskfile:
task buildWithout:
go build -o obsidian-exporter -v main.go➜ ./main -h
Usage of ./obsidian-exporter:
-listen-address string
The address to listen on for HTTP requests. (default ":8090")
-tag string
tag to check for (default "#unprocessed")
-vault-collection string
location of your files to check (default "./")Running the exporter and passing through a vault location:
./obsidian-exporter -vault-collection "/Users/$USER/Documents/personal-notes"
clone the repo and build the exporter:
git clone
task build
run the exporter:
./obsidian-exporter -vault-collection "/Users/$USER/Documents/personal-notes"
To notify Telegram a bot token and chat ID need to go into a file for alertmanager to consume. This example
uses a 1password template in example/alertmanager/alertmanager.yml.tpl
Tune alert.yml to alert on the total number of unprocessed notes, the default set in the example alerts on greater than 8 unprocessed notes
`expr: total_unprocessed_notes > 8`
task example:up
Footnotes
-
Actually, this doesn't need Obsidian to work. It'll work on any folder with Markdown files in (as long as they have tags in them) ↩
