This repo demonstrates monitoring a kSQL pipeline using a Chronograf dashboard. JMX metrics, like kittens, require an element of mustering.
kSQLDB and Chronograf, paired with jmxtrans and Kafka offer a pipeline toolkit to capture, filter and depict JMX metrics at scale. JMXTrans sends all JVM metrics to an influxDB database. A Kafka broker has ~150 built in metrics; which can quite easily exceed the data throughput of messages for smaller kafka clusters. So with whiteisting and filtering for nominated JMX metrics types, JMX pipelines can be built to feed a dashboard with a specific, defined role.
One possible use of a filtered JMX dashboard is topic-level monitoring of streaming pipelines; where message produce metrics at the topic level can be used to determine the health of a stream processing application.
This demo uses a public dataset GDELT. The data endpoint publishes a CSV file every fifteen minutes with one CSV line for a news story that was published online, during the last 15 minutes. The file does not contain the news story itsef; rather it contains metadata about the new story: such as the URL, various categorizations (type, country, etc), lat/long of the principal actors, an AI estimation of the tone of the story, among others. In total each line contains a total of 61 attributes for each story. There are typically 3000-10000 stories records every fifteen minutes; millions per day; and billions downloadable as CSVs online.
 Note - this KSQL Topology is rarely 100% correct as it is refreshed infrequently.
Note - this KSQL Topology is rarely 100% correct as it is refreshed infrequently.

It consists of:
   docker-compose.yml - docker compose yaml for all containers
                runme - a shell script to initialize all objects, load data and create the streaming pipeline
              getNews - a shell script to pull more test data from data.gdeltproject.org
  config/connect.json - a jmxtrans config file to extract nominated jmx metrics from Kafka Connect
      config/gde.json - a jmxtrans config file to extract topic producer metrics from nominated topics in teh streaming app
    config/kafka.json - a jmxtrans config file to extract nominated jmx metrics from Kafka brokers (not used yet)
 config/countries.sql - an init file used to populate a countries table in postgres
         ksqlapp.json - a Chronograf dashboard (not integrated with the current release)
                 data - persistent data subdirectories for postgres, influx and Chronograf
Instructions:
Clone/download the repo
docker-compose up
Login to Chronograf using the URL below:
* The default username/password is admin/admin
* Create a Data Source for influxdb. URL=influxdb:8086, username=root, password=root, database=influxdb.
* Import dashboard ksqlapp.json. No data is visible yet.
To run the demo:
- Clone or download the repo, unpack and cd to the directory. Start the docker daemon with 8GB RAM. Add this line to your /etc/hosts:
127.0.0.1 localhost ksqldb-server kafka1
- Stand up the docker-compose. This takes approx ten minutes to pull and start all images.
docker-compose up
- In a second terminal window, verify that all containers are in status "up" If not, then run docker-compose start to restart any stopped containers
$ docker-compose -p ksqdb-jmx-monitoring-master ps
      Name                    Command                  State                           Ports
-----------------------------------------------------------------------------------------------------------------
Postgres           docker-entrypoint.sh postgres    Up             5432/tcp
chronograf         /entrypoint.sh chronograf        Up             0.0.0.0:8888->8888/tcp
control-center     /etc/confluent/docker/run        Up             0.0.0.0:9021->9021/tcp
influxdb           /entrypoint.sh influxd           Up             8083/tcp, 0.0.0.0:8086->8086/tcp
jmx-connect        /docker-entrypoint.sh star ...   Up             9999/tcp
jmx-gde            /docker-entrypoint.sh star ...   Up             9999/tcp
jmx-kafka          /docker-entrypoint.sh star ...   Up             9999/tcp
kafka-connect-01   bash -c echo "Installing C ...   Up (healthy)   0.0.0.0:8083->8083/tcp, 9092/tcp
kafka1             /etc/confluent/docker/run        Up             0.0.0.0:3001->3001/tcp, 0.0.0.0:9092->9092/tcp
ksqldb-cli         /bin/sh                          Up
ksqldb-gde         /usr/bin/docker/run              Up             0.0.0.0:8088->8088/tcp
schema-registry    /etc/confluent/docker/run        Up             0.0.0.0:8081->8081/tcp
zookeeper          /etc/confluent/docker/run        Up             2181/tcp, 2888/tcp, 3888/tcp
- Open http://localhost:9021 to verify that Confluent Control Center is running.

Check these:
a. on the Launch page, check verify: "Healthy Clusters"=1, "KSQL CLusters"=1 and "Connect Clusters"=1
b. Under CO Cluster 1 | Topics, check for a total of four topics; for Kafka Connect and kSQL processing
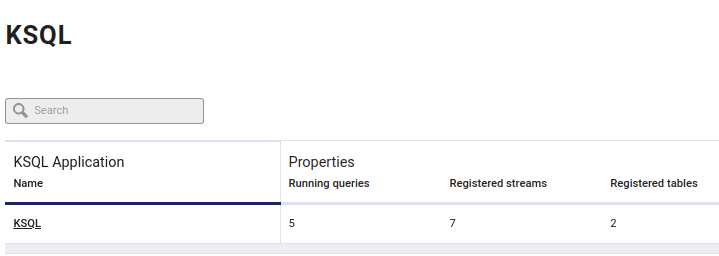
c. Under KSQL check that "Running Queries"=0 and "Registered Streams"=1
d. Under Connect | Cluster Name="cdc" each of the four columns should show a value of 0
If you see different values, then some containers may not have started (so start them manually)
Or, if you are reusing containers, then see the steps to initialize containers below.
-
Open http://localhost:8888 to check if Chronograf is running.
-
The containers are initialized and ready. The "runme" script executes all steps to build objects for the demo. Run runme with "--interactive" to run the demo interactively. Wait at least five seconds between pressing to ensure that kSQLDB streams and tables have been created before running the next step.
./runme --interactive
To run it without any prompts, just run it without any argument:
./runme
Press when prompted, or wait for completion. The last prompt should be :
Loading  data/gdelt/20191205000000.export.csv into Postgres ...
COPY 4356
 count
-------
  6559
(1 row)

Finished!
Run getNews to load up yesterdays news
- Check that the kSQLDB data pipeline is running by checking the KSQL status page in Confluent Control Center

Similarly, Kafka Connect jobs should all be running:

- Import the dashboard into Chronograf
Press "Get Started"
Change the InfluxDB URL to "http://influxdb:8086"
Connection Name="Influx 1 "
Username="root"
Password="root"
Click "Add Connection"
You should see "Connected to Influx 1 successfully"
For "Select dashboards you would like to create:", press "skip"
For "Kapacitor Connection", press "skip"
For "Setup Complete", press "View Connections"

In the left sidebar, select "Dashboards" | Import Dashboard and drop the file "chronograf_GDE.json" into the dialog
Click Continue
For "Reconcile Sources" click "Done" without making any changes.
You should see "Dashboard Imported Successfully".
Click on dashboard "GDE2".
Press the upper-right Dashboard icon to view the dashboard in presentation mode.
You should see this:

- run "getNews" to load Yesterdays News - this will download, unpack and load new stories for YYYYMMDD-1 of your current date. You can control-C at any time to halt loading. It requires an internet connection, and it will consume tens/hundreds of MB over several minutes.
./getNews
- Switch back to the Chronograf dashboard to observe metrics and data streaming. <>
URLs: Confluent Control Center: http://localhost:9021 Chronograf: http://localhost:8888