I am using n-body to compare the performance among Rust, PyO3 and Python.
This repo includes three parts of code:
rnbodyis Rust version, source code from benchmarksgame Rust .rnbody_pyo3is python using pyo3 version, the main functionadvanceis using rust code to calculate.pnbody.pyis python version, source code from benchmarksgame Python with slightly update onBODIESdata type.
rnbody: Make sure installedrustandcargo. And then runcargo run 10000inrbodyfolder. (10000is steps which used in calculating nbody)rnbody_pyo3: - Install rust nightly. Currentlymasterbranch of PyO3 is able to use stable rust version. But I am using0.10.1of pyo3 (Reuqired Python3). - Install setuptools-rust . - In folderrnbody_pyo3runpython setup.py develop. - Run./pnbody_pyo3 10000(usingPlanetstruct to representing planet data) or./pnbody_pyo3 10000 --list(usingvecto representing planet data)pnbody.py: Run./pnbody.py 10000.
Testing setup:
- PC: ThinkPad T490
- CPU: intel i7 8th Gen
- OS: Ubuntu 16.04
- Python version: 3.7.6
- rustc version: 1.46.0-nightly (
ff5b446d22020-06-23) - cargo version: 1.46.0-nightly (
089cbb80b2020-06-15) - PyO3 version: 0.10.1
setuptools-rust: 0.10.6
Run following commands 100 times each with different steps value.
(Used steps: 10K, 100K, 1M, 10M)
- Python
./pnbody.py <steps> - PyO3 with
liststruct./pnbody_pyo3 <steps> --listinrnbody_pyo3folder. - PyO3 with rust
Planetstruct./pnbody_pyo3 <steps>inrnbody_pyo3folder. - Rust
cargo run <steps>inrnbodyfolder.
Performance chart:
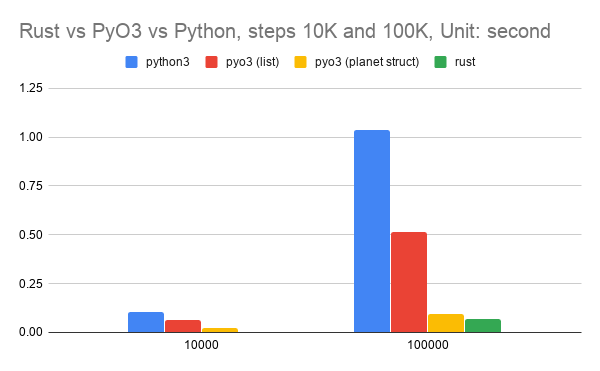
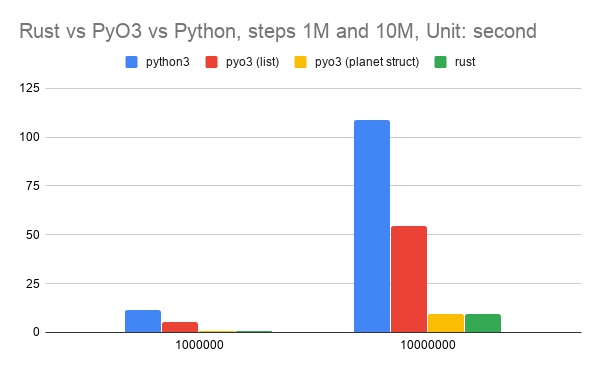
After running each combination over 100 times on my computer, the below table shows the results.
| steps | 10,000 | 100,000 | 1,000,000 | 10,000,000 |
|---|---|---|---|---|
| python3 | 0.1068 | 1.0352 | 11.3587 | 108.8791 |
| pyo3 (list) | 0.0616 | 0.5126 | 5.4035 | 54.7067 |
| pyo3 (planet struct) | 0.0215 | 0.0952 | 0.8882 | 9.5147 |
| rust | 0.0009 | 0.0714 | 0.8708 | 9.204 |
| each value is the average value after running 100 times. Unit: second | ||||
Split chart into two charts since 10K and 10M have quite large scale differences.

