Open-source library to compute landscape metrics in the Python ecosystem (NumPy, pandas, matplotlib...)
Citation: Bosch M. 2019. "PyLandStats: An open-source Pythonic library to compute landscape metrics". PLOS ONE, 14(12), 1-19. doi.org/10.1371/journal.pone.0225734
-
Read GeoTiff files of land use/cover:
import pylandstats as pls

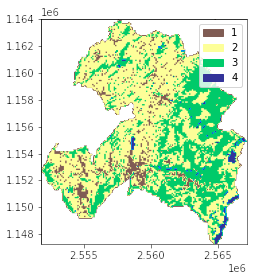
ls = pls.Landscape("../data/processed/veveyse-AS18_4.tif")
ls.plot_landscape(legend=True)
-
Compute pandas data frames of landscape metrics at the patch, class and landscape level:
class_metrics_df = ls.compute_class_metrics_df(
    metrics=["proportion_of_landscape", "edge_density", "euclidean_nearest_neighbor_mn"]
)
class_metrics_df
class_val proportion_of_landscape edge_density euclidean_nearest_neighbor_mn 1 7.749572 19.102211 309.244705 2 56.271868 50.599270 229.079970 3 33.946252 38.167200 253.299859 4 2.032308 3.722177 552.835154 -
Analyze the spatio-temporal evolution of landscapes:
import matplotlib.pyplot as plt

input_filepaths = [
    "../data/processed/veveyse-AS97R_4.tif",
    "../data/processed/veveyse-AS09R_4.tif",
    "../data/processed/veveyse-AS18_4.tif",
]

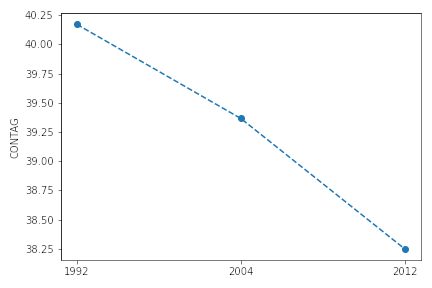
sta = pls.SpatioTemporalAnalysis(input_filepaths, dates=["1992", "2004", "2012"])
sta.plot_metric("contagion")
-
Zonal analysis of landscapes
See the documentation and the pylandstats-notebooks repository for a more complete overview.
The easiest way to install PyLandStats is with conda:
$ conda install -c conda-forge pylandstats
which will install PyLandStats and all of its dependencies. Alternatively, you can install PyLandStats using pip:
$ pip install pylandstats
Nevertheless, note that in order to define zones by vector geometries in ZonalAnalysis, or in order to use the the BufferAnalysis and SpatioTemporalBufferAnalysis classes, PyLandStats requires geopandas, which cannot be installed with pip. If you already have the dependencies for geopandas installed in your system, you might then install PyLandStats with the geo extras as in:
$ pip install pylandstats[geo]
and you will be able to use the aforementioned features (without having to use conda).
To install a development version of PyLandStats, you can first use conda to create an environment with all the dependencies and activate it as in:
$ conda create -n pylandstats -c conda-forge geopandas matplotlib-base rasterio scipy openblas
$ conda activate pylandstats
and then clone the repository and use pip to install it in development mode
$ git clone https://github.com/martibosch/pylandstats.git
$ cd pylandstats/
$ pip install -e .
- The computation of the adjacency matrix in transonic has been implemented by Pierre Augier (paugier)
- Several information theory-based metrics from Nowosad and Stepinski [1] were added by achennu
- With the support of the École Polytechnique Fédérale de Lausanne (EPFL)
- The Corine Land Cover datasets used for the test datasets were produced with funding by the European Union
- Nowosad, J., & Stepinski, T. F. (2019). Information theory as a consistent framework for quantification and classification of landscape patterns. Landscape Ecology, 34(9), 2091-2101.


