Extended pandas-like interface for the Swiss Federal Statistics Geodata (GEOSTAT).
Citation: Bosch M. 2019. "swisslandstats-geopy: Python tools for the land statistics datasets from the Swiss Federal Statistical Office". The Journal Open Source Software 4(40), 1511. https://doi.org/10.21105.joss.01511
Many datasets of the GEOSTAT inventory are provided in a relational database format which allows storing a coolection of variables into a single CSV file, nevertheless, libraries to process geographical raster data aree rarely capable of processing such format. Therefore, the aim of swisslandstats-geopy is to provide an extended pandas DataFrame interface to such inventory (see the "Features" section below).
The target audience of swisslandstats-geopy is researchers and developers in environmental sciences and GIS, who intend to produce repeatable and reproducible computational workflows that make use of the geodata inventory provided by the SFSO.
- Automatically read CSV files from the GEOSTAT inventory into dataframes
- Export columns into
numpyarrays andGeoTIFFfiles - Clip dataframes by vector geometries
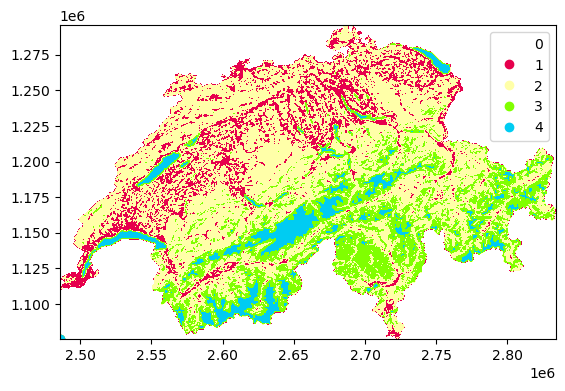
- Plot information as raster maps
import swisslandstats as sls

ldf = sls.from_url()
ldf.plot("LU09_4", cmap=sls.noas04_4_cmap, legend=True)
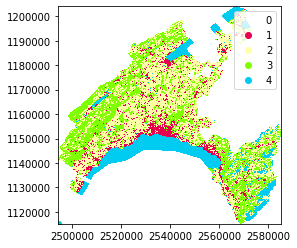
vaud_ldf = ldf.clip_by_nominatim("Vaud, Switzerland")
vaud_ldf.plot("LU09_4", cmap=sls.noas04_4_cmap, legend=True)See the example notebook for a more thorough overview and example uses with the land use statistics and population and household statistics. You might click the Binder badge above to execute it interactively in your browser.
Examples of applications of the library in the academic literature include:
- The assessment of the carbon sequestration for the canton of Vaud (see the dedicated GitHub repository with the materials necessary to reproduce the results)
- The evaluation of the spatio-temporal patterns of LULC change in the urban agglomerations of Zurich, Bern and Lausanne (see the dedicated GitHub repository with the materials necessary to reproduce the results).
The easiest way to install swisslandstats-geopy is with conda as in:
conda install -c conda-forge swisslandstats-geopyIf you want to be able to clip dataframes by vector geometries, you will need geopandas (and osmnx to clip dataframes from place names e.g., "Zurich, Switzerland"). The easiest way to install such requirements is via conda as in:
conda install -c conda-forge geopandas osmnx rasterioAlthough rasterio can be installed via pip, it is recommended to install it via conda to avoid potential issues with GDAL (such as the support of the Swiss EPSG coordinate reference systems).
Then you can install swisslandstats-geopy via pip as in:
pip install swisslandstats-geopy- Add missing colormaps
- Automatically assign columns to cmaps when plotting
- Exceptions for no land use/land cover columns
- Implement methods to merge DataFrames from multiple csv files


