DataGenie Hackathon 2023
The goal is to create an efficient time series model selection algorithm
Application demo SF:
ToDO checkpoints:
- Classification Algorithm
- (Data Generation) Pick/generate the necessary features and label the data required for classification
- Train Classification Model with (5 output labels) and pickle\store the model.
- Generate predictions
- REST API
- setup a template and have a placeholder function
- Setup a POST method to use the classification model
- Simple UI & Deployment
- setup a template and have a placeholder function
- Use the API defined to Display it to the users
Time series Models used:
- Prophet
- ARIMA
- ETS
- XGBoost
Deployment
Since I used Streamlit for the UI, the frontend is being deployed, but the backend API is not deployed, which means we cannot use the deployed version.
Approach Notes:
The full documentation explaining how the classifier is built can be found in this link and video demo. This is a condensed version of the PDF
Step 1: Data Generation and Classifier Model Training
-
Dataset: Used sample data from the hackathon.
-
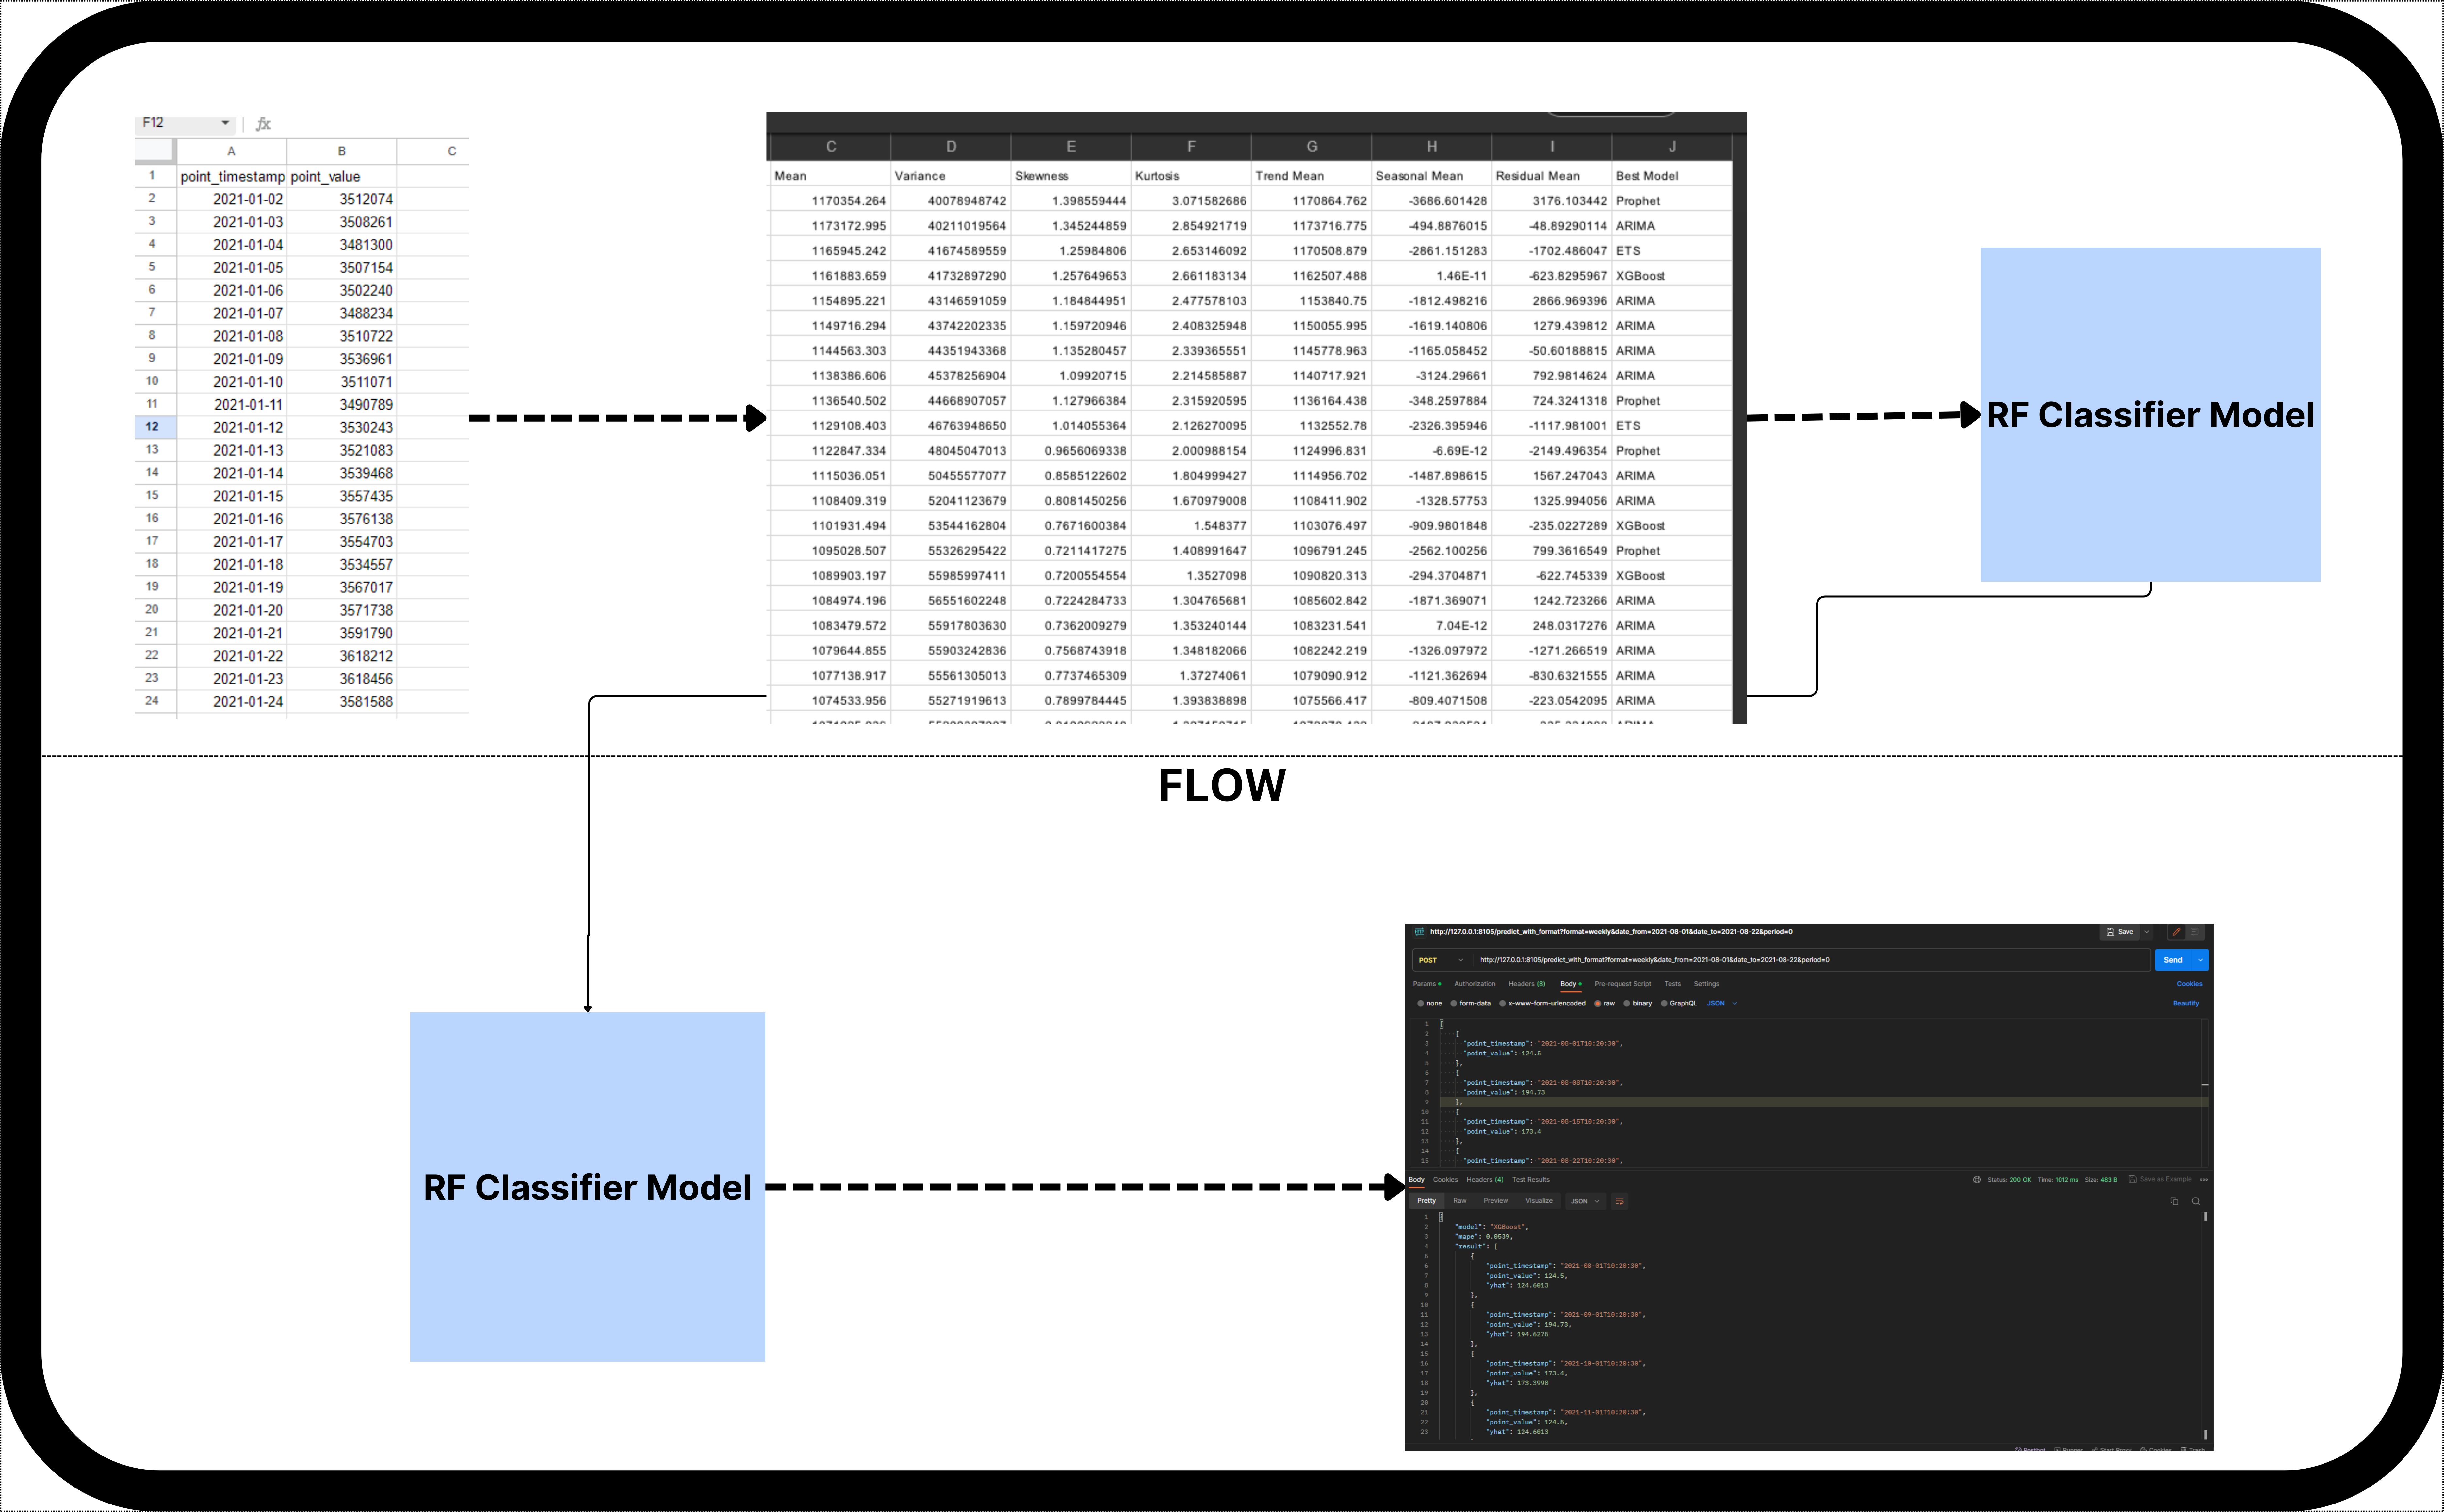
Approach 1: Divided problem into four formats - hourly, daily, weekly, monthly. Built four classifiers for each format. Benefits of separate models: Specialization, custom feature engineering, real-world pattern differences. Limitations: Cannot predict formats not predefined, increased complexity.
-
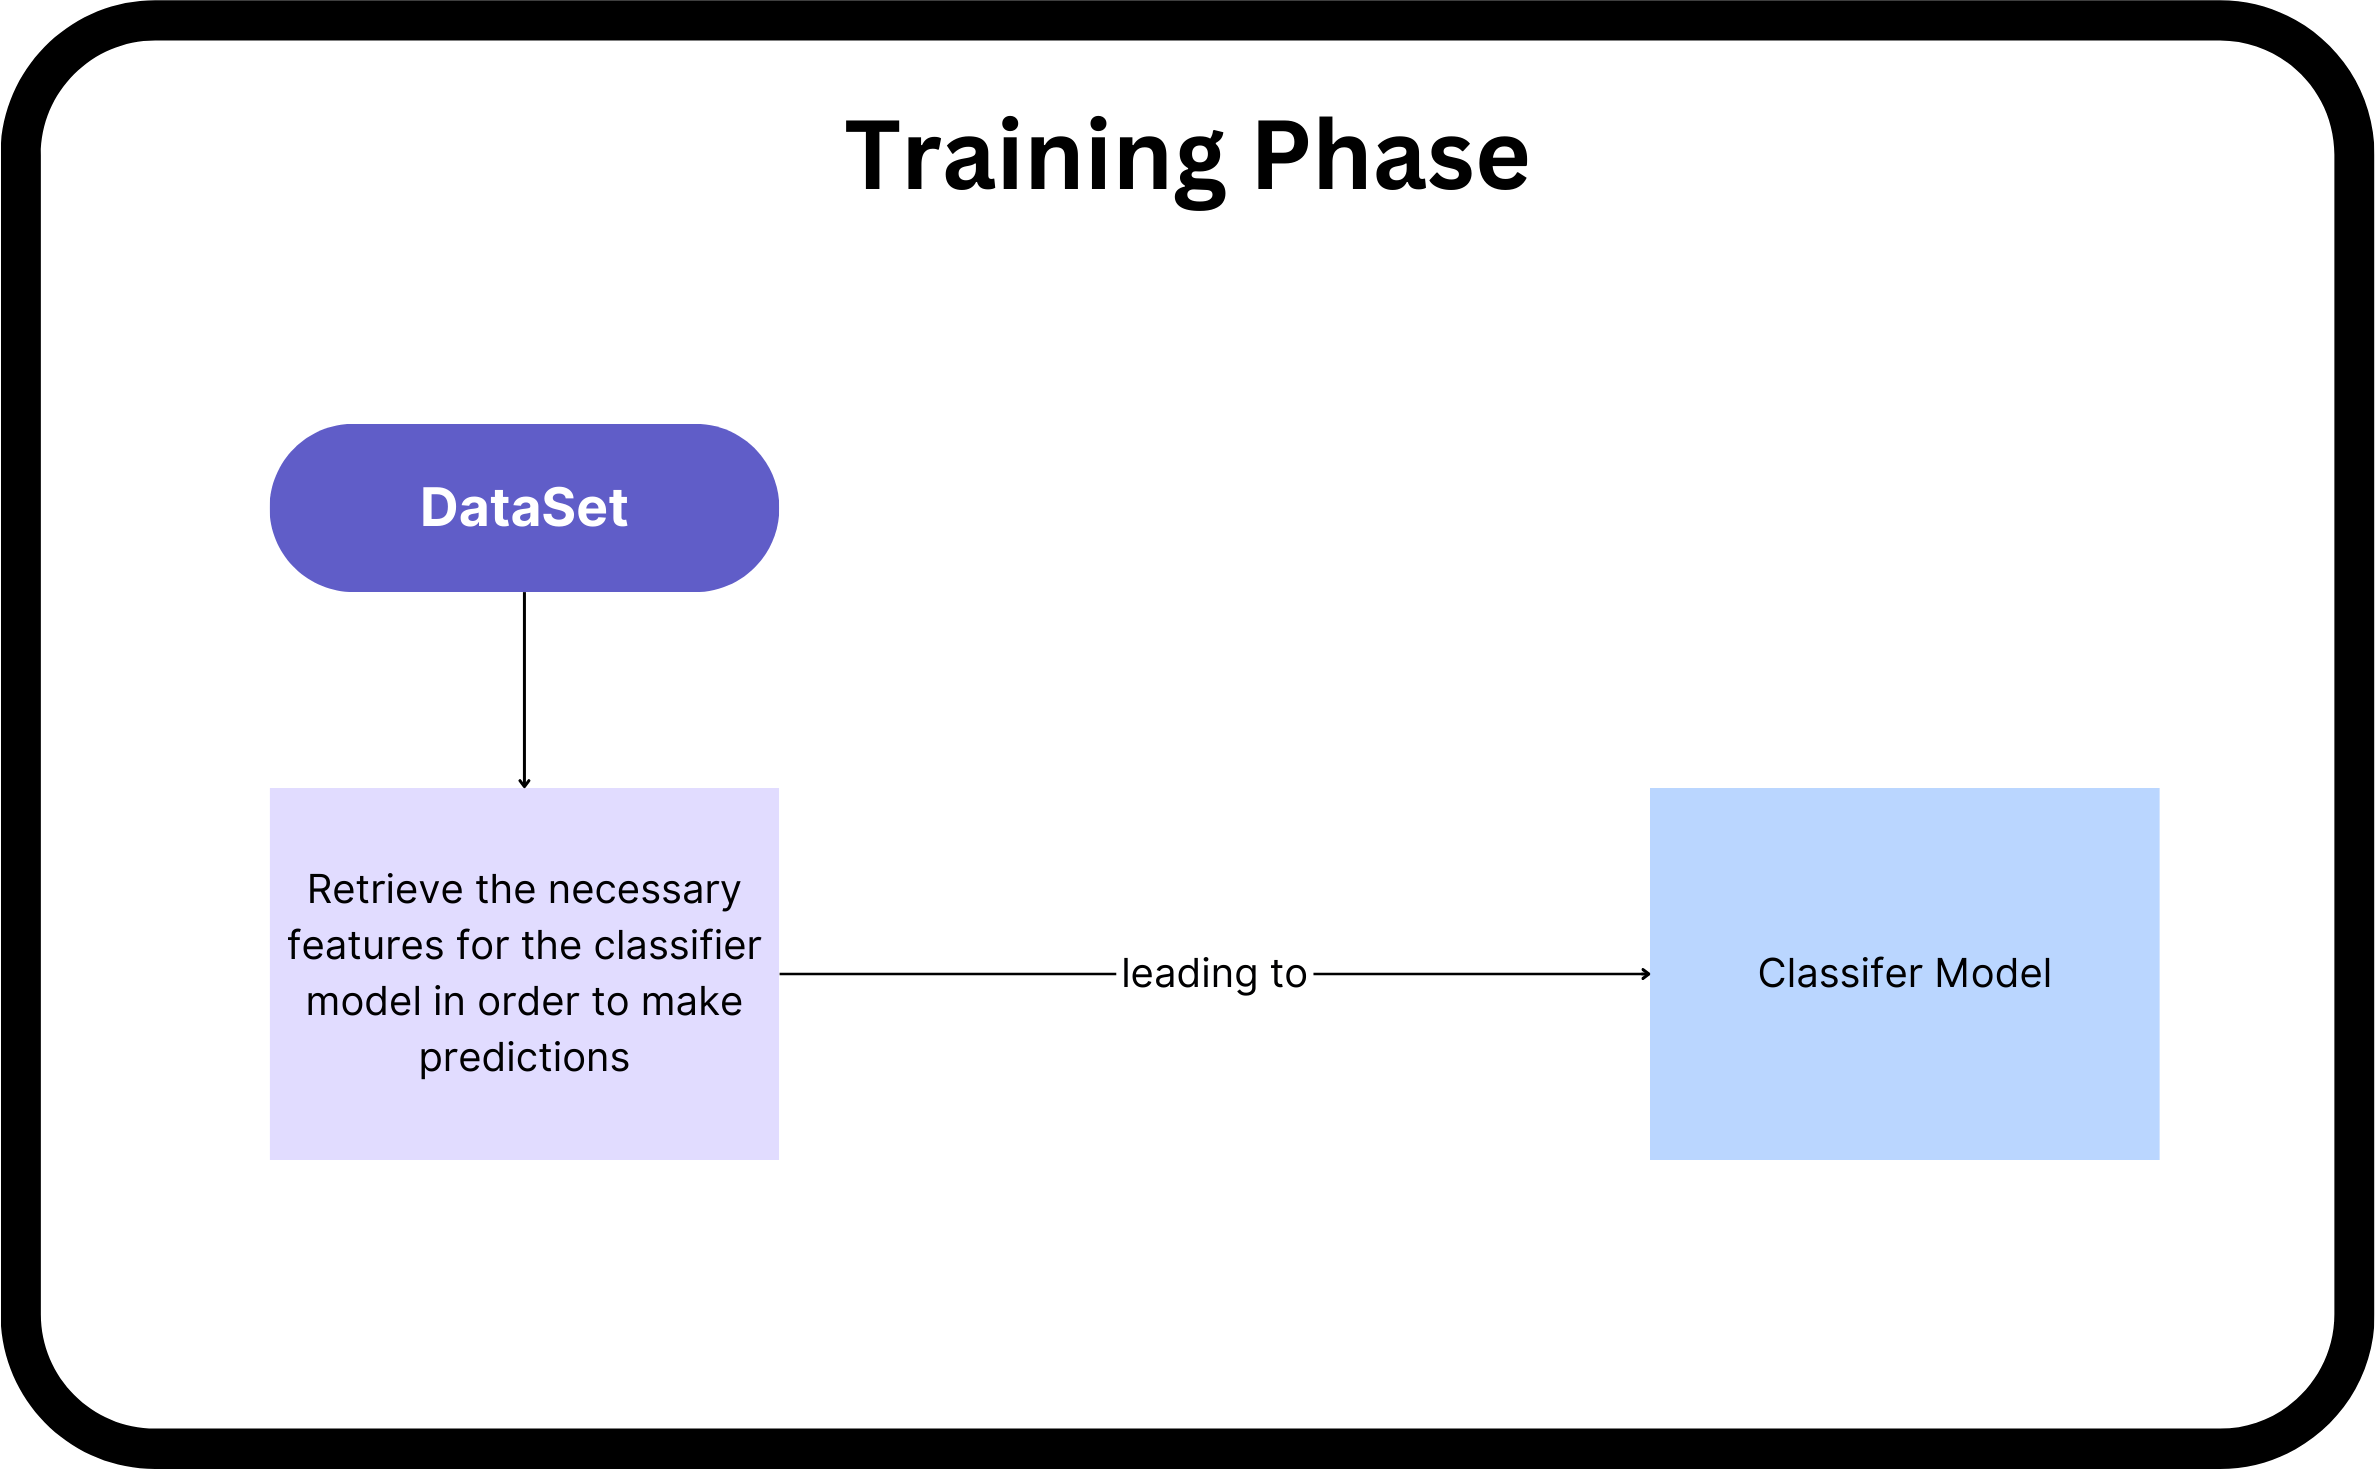
Combined Approach2: Explored combining data from all formats into one dataset. Benefits: Broader learning, useful when decision boundaries are not distinct or formats have similarities. Combined preprocessed data into a single file. Balanced dataset and employed Random Forest with grid search for classification.
-
Data Generation: Utilized four time series models: ARIMA, XGBoost, Prophet, ETS. Combined samples, removed duplicates and interpolated missing values.
-
Preprocessing: Identified best data points for each model using rolling windows and feature extraction. Balanced dataset by undersampling and removing uncorrelated features.
-
Classifier: Used Random Forest with grid search to find best parameters.
Step 2: Backend API and Frontend
- Pickled classifier models.
- Created two FastAPI endpoints:
POST /predict?date_from=2021-08-01&date_to=2021-08-03&period=0
POST /predict_with_format?format=daily&date_from=2021-08-01&date_to=2021-08-03&period=0
- Frontend: Three pages - two for Postman-like interface, one for user-friendly CSV upload. Provides charts and predicted values based on forecasting periods.
PLAN:
Getting Started:
Clone the repo in local and follow these steps.
Backend Setup:
-
Create a virtual environment:
cd backend python3 -m venv venv -
Activate the virtual environment:
venv\Scripts\activate
-
Install the requirements and run the application:
pip3 install -r requirements.txt
uvicorn main:app --reload --port 8105
Frontend Setup:
-
Create a virtual environment:
cd frontend python3 -m venv venv -
Activate the virtual environment:
venv\Scripts\activate
-
Install the requirements and run the application:
pip3 install -r requirements.txt
streamlit run main.py


