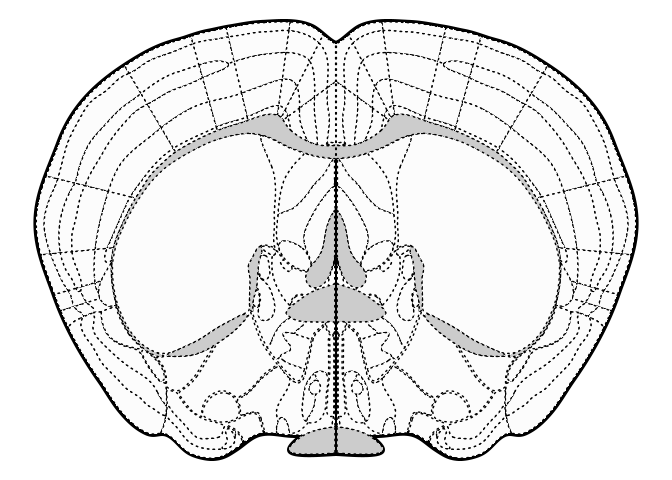
The goal of nobrainr is to provide a simple interface to plot plates from the Mouse Allen Brain Atlas.
You can install the development version from GitHub with:
# install.packages("devtools")
devtools::install_github("matiasandina/nobrainr")library(nobrainr)
## basic example code
plot_atlas(AP = 0,half = F)
#> Loading required package: grImport
#> Loading required package: grid
#> Loading required package: XML
#> ℹ Coloring by parent ROIYou can also use the bw argument to get the bw version.
plot_atlas(AP = 0,half = F, bw = T)
#> ℹ BW coloringA little bit of knowledge in R can help manipulate the resulting
ggplot2 object. We can use verbose = FALSE to avoid all the user
feedback.
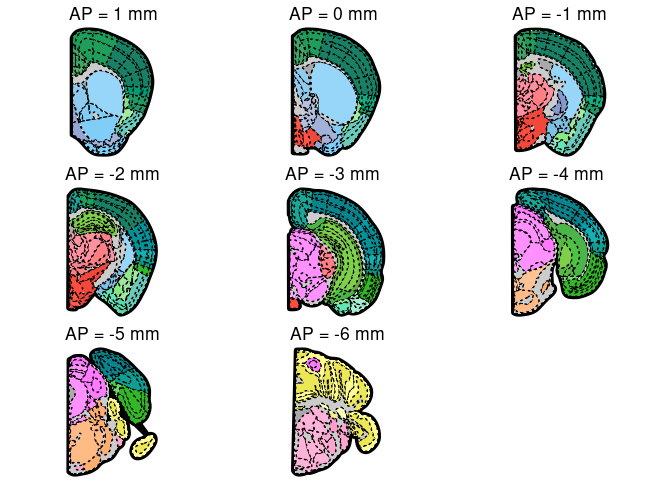
# AP values need not be exact, they are rounded to correct plates
desired_AP <- seq(1, -6, -1)
plot_list <-
purrr::map(
  desired_AP,
  ~plot_atlas(AP=.x, half=T, verbose=F) +
    ggplot2::labs(title = glue::glue("AP = {.x} mm"))
)
cowplot::plot_grid(plotlist = plot_list)If you want to export the plots to an svg format for presentation you
can use the ggsave function from the ggplot2 package.
p1 <- plot_atlas(0)
ggplot2::ggsave(filename = "plot_title.svg",
plot = p1) # <- will save to the local directory, check ?ggsaveThis package comes with data that contains cell counts in different brain regions.
trial_df
#> # A tibble: 568 x 4
#>    parent side  value mm_from_bregma
#>    <chr>  <chr> <dbl>          <dbl>
#>  1 MOp    left      6           2.72
#>  2 MOs    left      6           2.72
#>  3 PL     left     17           2.72
#>  4 MOp    right     0           2.72
#>  5 MOs    right    14           2.72
#>  6 PL     right    18           2.72
#>  7 ACAd   left     24           2.01
#>  8 DP     left      3           2.01
#>  9 EP     left      3           2.01
#> 10 MOp    left      6           2.01
#> # … with 558 more rows
You can plot the counts using plot_roi_counts().
plot_roi_counts(trial_df, AP=1.1, half=FALSE)
#> ℹ Coloring by `value` in `count_df`
Mind that not all AP levels are present on this sample data. Within each
AP, not all ROIs have data either. Because we can’t plot nonexistent
data, nobrainr will throw an error.
plot_roi_counts(count_df = trial_df, AP=1, half=FALSE)
#> Error: No counts found for AP=1 in `count_df`This is a preliminary release. Please file issues to improve the package.
This package contains data coming from wholebrain package.


