PyBer, a ride-sharing application company, has requested an analysis of all the rideshare data from January to early May 2019. The purpose of this analysis is to help improve access to ride-sharing services and determine affordability for underserved neighborhoods with compelling visualizations.
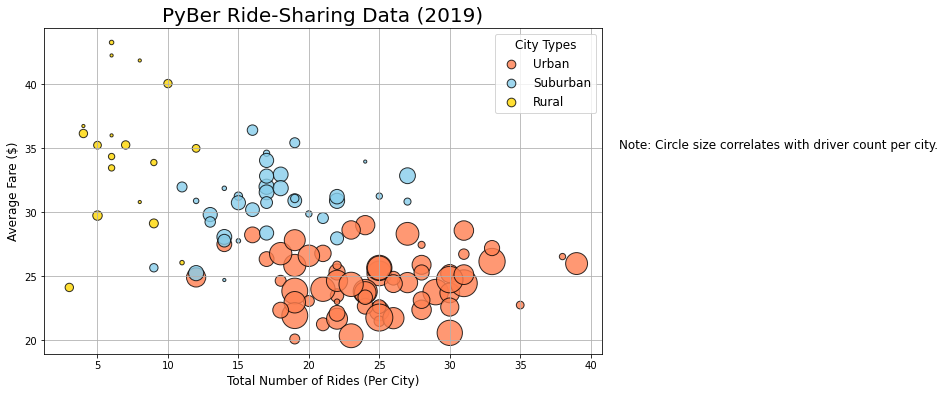
- Rural cities have a higher average fare and lower number of rides when compared to urban and suburban cities
- The urban area has the most drivers per city
- The rural area has the least drivers per city
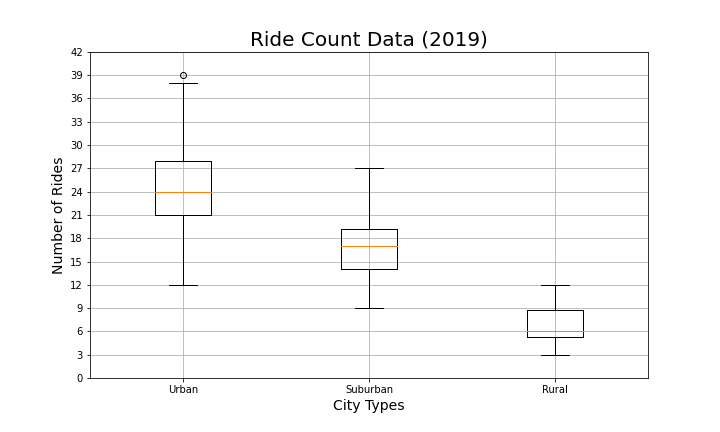
- There is one outlier near 40 rides in the urban city type
- The average number of rides in the rural cities is roughly four and 3.5-times lower per city compared to the urban and suburban cities
- There are no outliers found
- The average number of drivers in rural cities is 9 to 4 times less per than urban and suburban cities
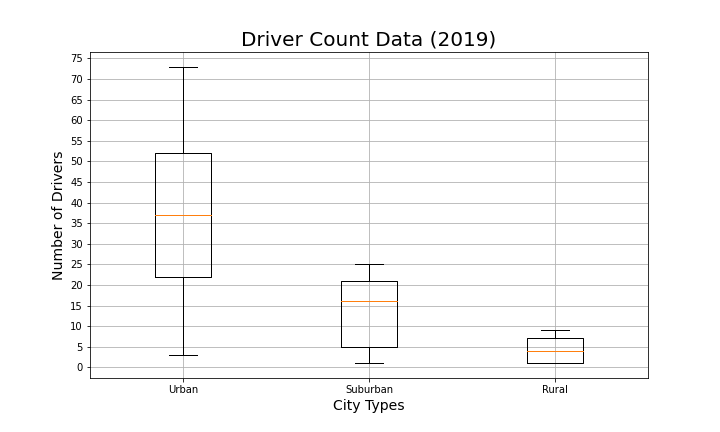
- There are no outliers found
- The average fare for rides in the rural cities is about $11 and $5 more than the urban and suburban cities
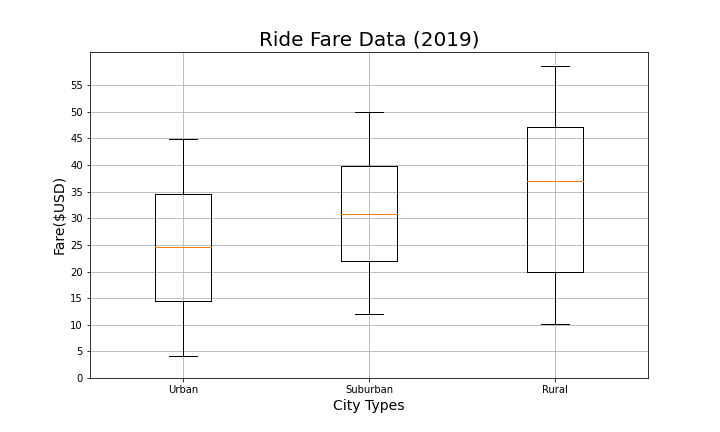
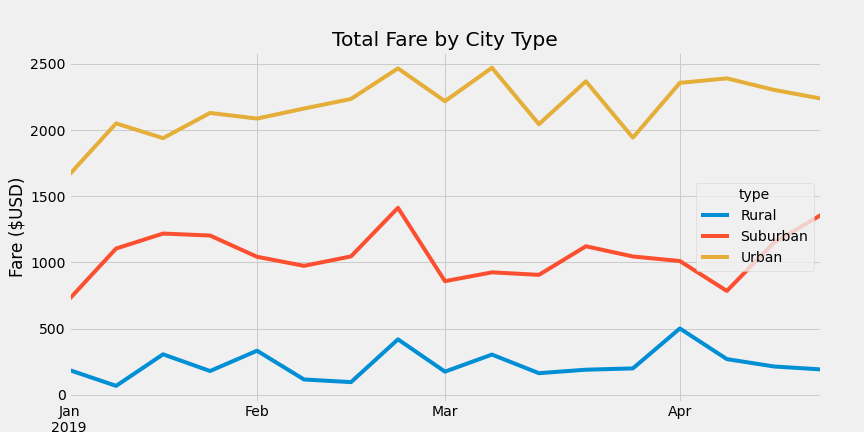
- Urban cities consistently have the highest total fare cost, followed by suburban and then rural
- Urban and suburban areas often have a denser population when compared to rural areas, which could be a factor in the pricing discrepancy
- For all city types, total fares increased from the start of January to the beginning of February
- The increase could be due to the traveling during the Holiday season in December followed by the New Year
I have three business recommendations to address the disparities among city types:
1. In the future, PyBer could eliminate the need for drivers by implementing a self-driving car service. As a result, underserved neighborhoods could have access to on-demand services with lower costs. In addition, the usage of self-driving cars would eliminate the driver cost. Therefore, PyBer could offer essentially the same service at a reduced rate.
2. Conduct further analysis and market research into rural cities. For instance, users in rural cities are willing to pay a higher cost than suburban and urban areas. We could guess why this occurs, but we do not have enough data to draw a precise conclusion.
3. Conduct further analysis on months or weeks when the number of rides consistently increases. For instance, the total fare increases in all three city types from January to February. Further data needs to be analyzed to determine if increasing the amount drivers would reduce the fare cost during these periods.
- Data Source:
city_data.csv,ride_data.csv - Source Code:
PyBer.ipynb,PyBer_challenge.ipynb - Software:
Python 3.7.10,Jupyter Notebook 6.3.0 - Libraries:
NumPy 1.21.4,Pandas 1.3.4,Matplotlib 3.5.0,SciPy 1.7.3