Ruby Heap Viz
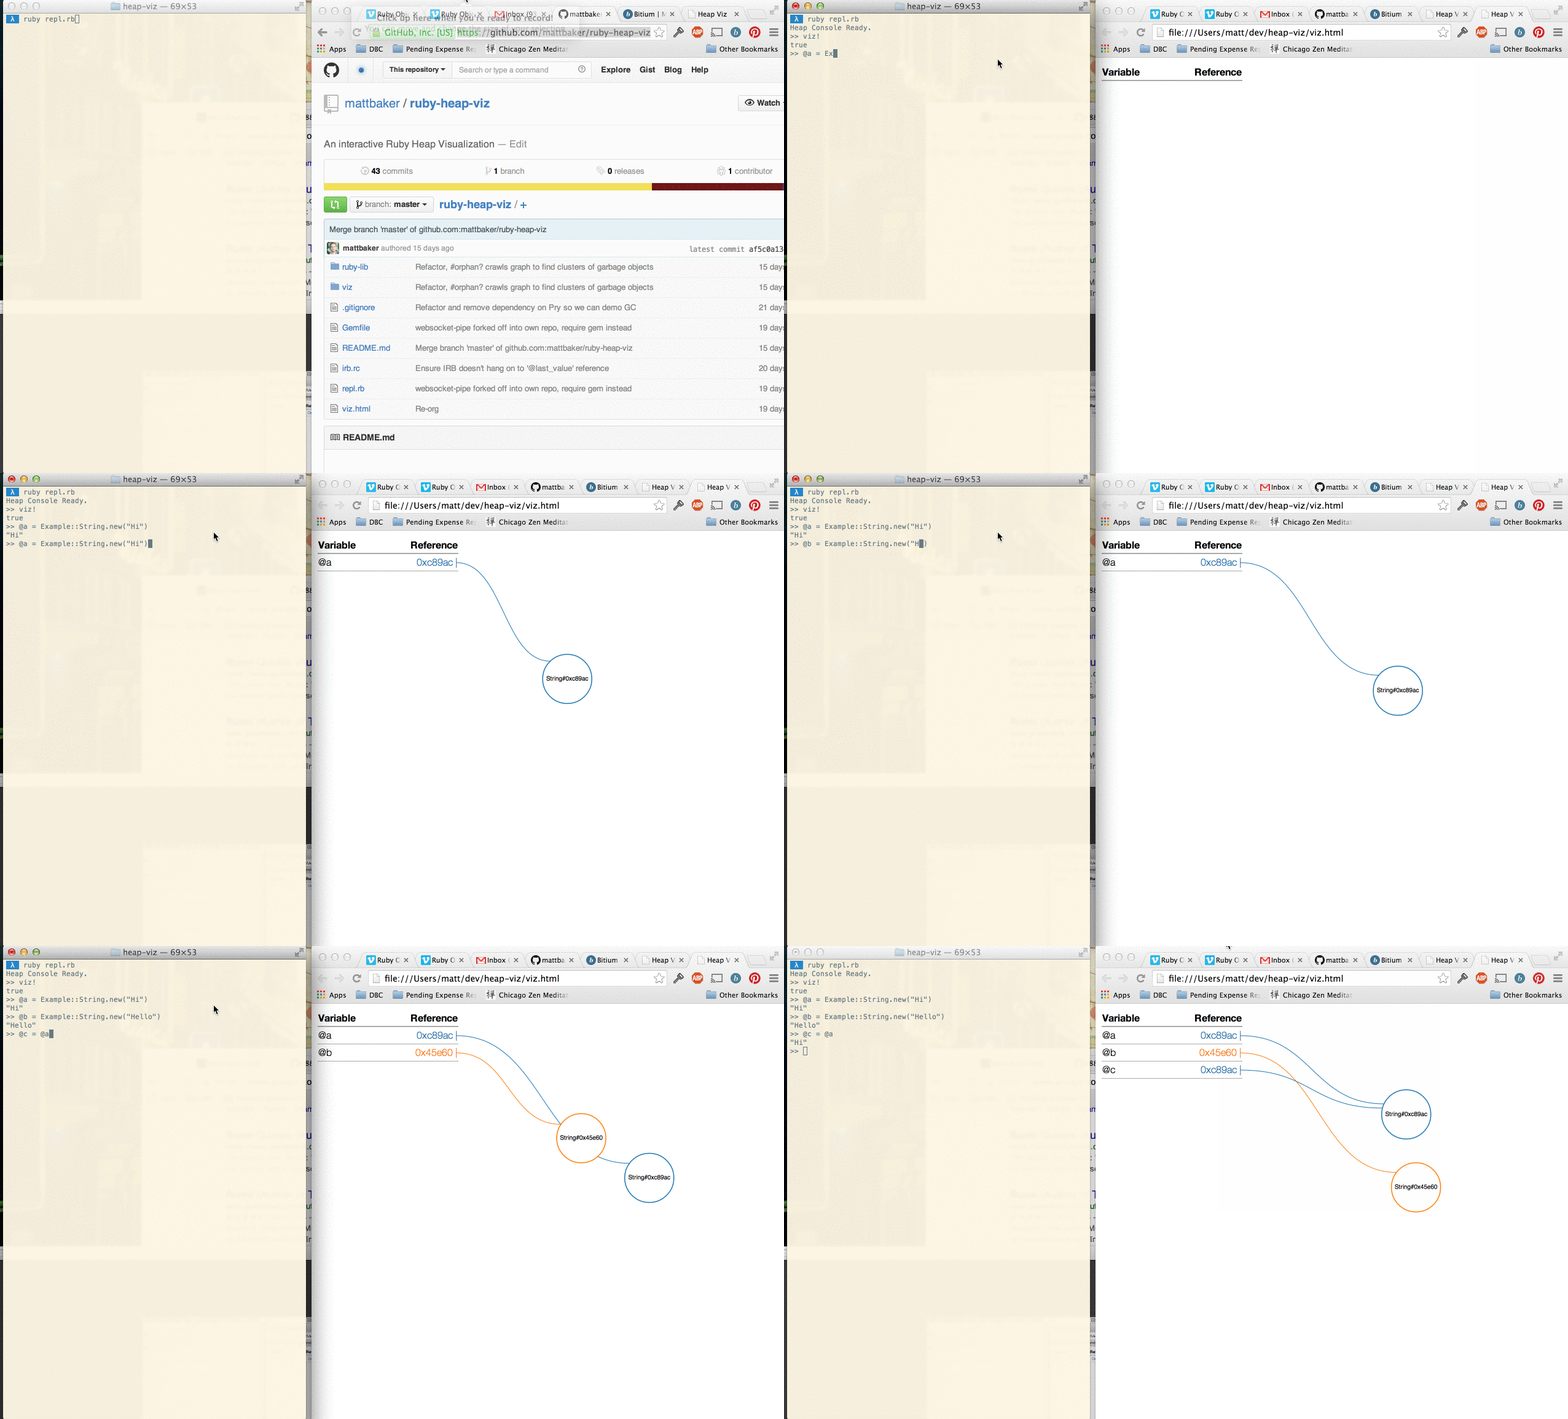
Ruby Heap Viz is an interactive Ruby object graph visualization. Use IRB and watch how Ruby's object graph responds! This is intended to a) be fun and b) serve as a learning tool for people to learn about objects, references and garbage collection.
This visualization is used at Dev Bootcamp during our unit on Ruby and its memory model.
Dependendencies
Ruby Heap Viz requires websocket-pipe.
Currently the Viz runs correctly with ruby 2.0, specifically 2.0.0-p645. Later versions work, but introduce some odd bugs. Until this issue is fixed, please be aware of the versioning issue.
Usage
Run bundle install.
Start the heap viz REPL (IRB) with ruby repl.rb. This will kick off a separate process for the websocket server, and start a thread locally that will periodically push the state of the heap to all websocket clients.
Call viz! in the REPL or open viz.html. It will connect to the websocket server and receive updates about the heap's state, then render the object graph with D3.
Some utility functions are available to you in IRB:
example!- creates an example scenario, including variables, object references, and a garbage-collectable objectreset!- unsets all instance variables and starts GC. This will not cleanup objects referenced by local variables.viz!- opensviz.htmlin your browser ifopen(1)if presentgraph_report- generates a list of objects retaining references to any objects in theExamplenamespace. Useful for debugging GC issues.
Currently the heap state code requires you to use classes under a specific namespace. Example::Array, Example::String and others are just aliases for the corresponding Ruby classes. You can add your own classes under the namspace too!
It's suggested that you use instance variables at the REPL. Local variables (due to scope constraints) will neither show up in the variable table nor will they be cleared in a reset!.
Simplifications
You'll notice the visualization uses Ruby's object ids as if they're actual pointers. Traversal of the object graph in Ruby is more complicated than this, but this is a useful metaphor to understand that setting x = y copies y's reference into x. People that need a deeper and more accurate visualization of Ruby's memory model should probably look elsewhere.
Example:
Heap Console Ready.
>> @greeting = Example::String.new("Hello")
>> @greetings = Example::Array.new
>> @greetings << @greeting
A longer video with annotations can be found here.
Cool Scenarios
Here are some examples to consider:
- Create an array and two objects, push those objects into the array to demonstrate references between objects
- Duplicate an array like the one above to demonstrate object duplication, as well as the fact that
#dupis a "shallow copy" - Add an object to an array, but do not assign a variable name to that object. This shows that objects can be in the object graph even if they're unnamed
- Create an orphaned object (e.g. add a string to an array, then
#popit) and callGC.startto demonstrate garbage collection
Have others? Submit a PR!
