function file: alluvial.m
example file: example.m
palettes file: palettes.m
This function produces alluvial diagrams from a Markow transition matrix. It displays the probability distribution over states at different points in time.
rng(1);
Q = rand(5);
Q = Q ./ sum(Q,2);
The user specifies the iterations at which the distribution over states has to be displayed. For example, we want to shot the first three time periods, the 99th and the 100th.
x = [1, 2, 3, 99, 100];
The plot_transitionscommand produces the final output.
alluvial.plot_transitions(Q, x, ylabels, xlabels, title);
Additionally, the user can provide the following options:
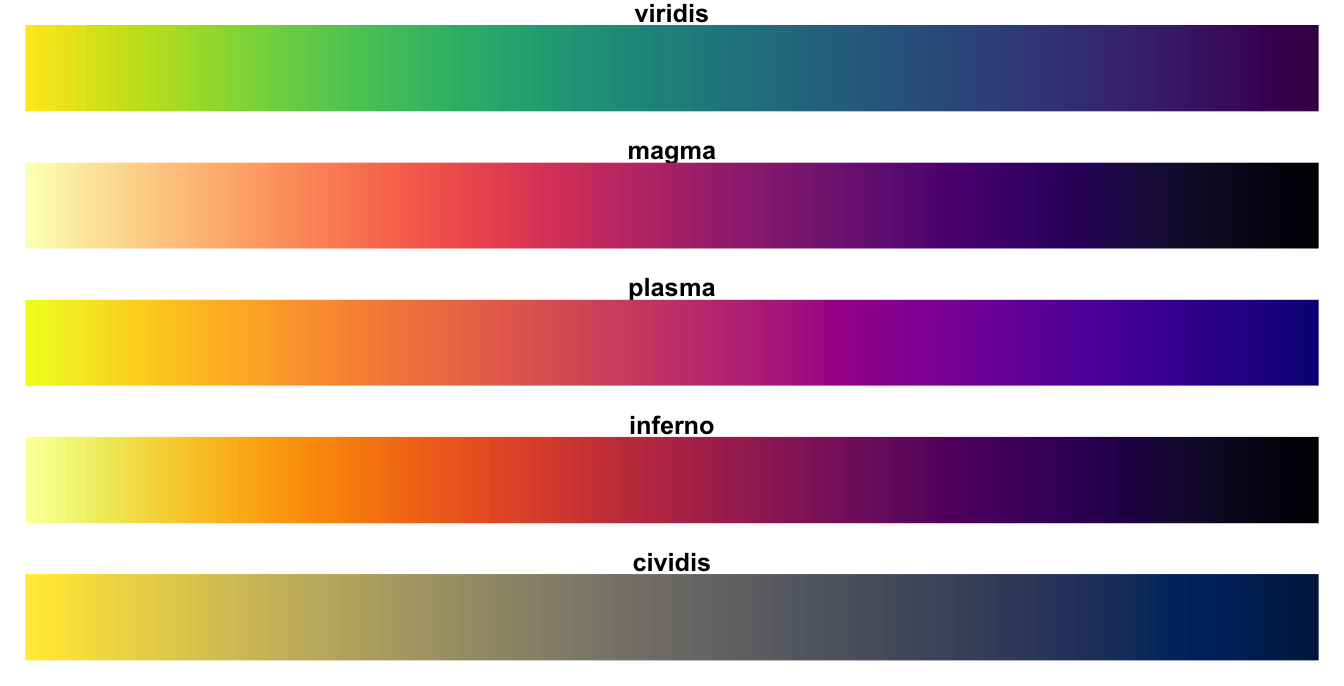
w0: initial state distributionxlabels: labels of the horizontal axisylabels: labels of the vertical axistitle: title of the graphpalette: color palette among viridian (default), inferno, magma, plasma, cividis
w0 = [1, 2, 4, 5, 1];
ylabels = ["Idea", "New", "Used", "Old", "Broken"];
xlabels = ["0", "1", "2", "\infty", "\infty"];
palette = "inferno";
title = "Product Life Cycle";
The parameters are inputed the MATLAB way.
alluvial.plot_transitions(Q, x, "w0", w0, "palette", palette, "ylabels", ylabels, "xlabels", xlabels, "title", title);


