Created for the University of California Berkley's Data Analytics course, this repository is a basic analysis of hypothesis and questions formed from the Maryland Traffic Accident reports. As an additional sample, we've also taken a look at crash reports from Montgomery county in Maryland. For the purposes of this analysis, we utilized Excel, Python, Pandas, Matplotlib, Seaborn and APIs.
Credits to:
mattf4171
martinperezmh
Samanaan
Nolan-Tonthat
CiciRose
Disclaimer: We are students
Maryland Statewide Vehicle Crashes
Crash Reporting - Drivers Data
Crash Reporting - Incidents Data
Maryland Physical Boundaries - County Boundaries (Detailed)
Maryland Political Boundaries - ZIP Codes - 5 Digits
According to the Zero Deaths Maryland website, Maryland has taken a data-driven approach for zero roadway fatalities and serious injuries. We wish to contribute to this cause by analyzing the various causes and effects of vehicle crashes. In this analysis, we analyzed the most hazardous conditions the state of Maryland to determine the following factors:
- What is the chance of injury dependent on impact location at time of collision?
- What is the chance of injury given vehicle body type?
- What effect does weather have on the amount of vehicle crashes?
- What is the correlation between driver distraction and substance abuse and the ACRS (Automated Crash Reporting System) Report Type?
Our report file can also be accessed here
Hypothesis: The probability of head-on collision is more common than being hit on the right-side of a vehicle
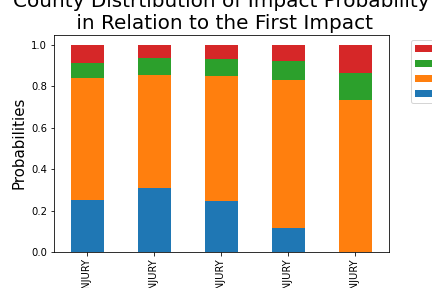
 The Montgomery County Data...
- shows that no fatal injuries occur from a rear-end collision but instead were predominantly from head-on collisions
- The category Possible injuries had the highest probability of being caused from rear-ended accidents
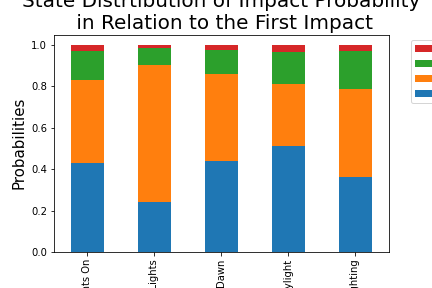
The Maryland State Data...
- We see that an impact from the right side of the vehicle is very minimal in terms of probability if ever in a collision. collisions that occur from the left of the vehicle are most apparent in Dark settings
- A head on collision has the highest probabilities throughout the categories of lighting descriptions for all state accidents. It is interesting to see that being hit from the back of the vehicle is most common in daylight settings, possibly because drivers have more distractions and if in traffic bumper to bumper lead to more cases of rear-ended accidents
- It is also interesting to see that the probability of being hit head-on is more apparent than rear-end when there is no lights on a dark night
Hypothesis: Motorcycles, and smaller vehicles, will yield more injuries in an accident.
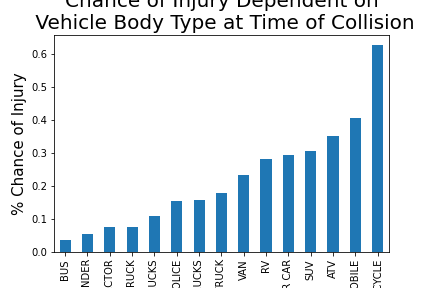
- Motorcycles had the highest chance of injury at 60%
- SUV, ATV, and Passenger Car around 30%
- Note: Bus accidents are the least prone to injury, speculatively due to size
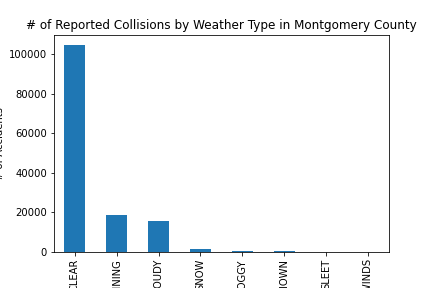
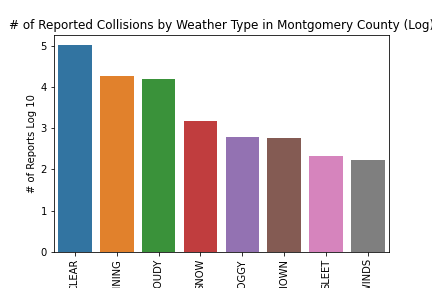
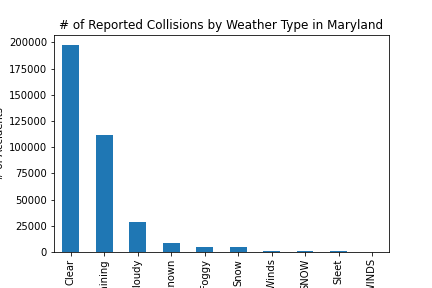
- Mode: "Clear" for both datasets
- has the highest number of accidents (106,202 and 197,604)
- makes up 73.1% & 43.9% of county and state data set, respectively
- Median: "Clear"
- Observations
- "Not Applicable" in state data means that the collision took place indoors (e.g. a parking garage, warehouse, etc.)
- Clear, Raining, and Cloudy makes up 97.3% of the county data set
- Including Not Applicable for the state data set, they make up 94% of the state data set
- Comparison with Injury Severity (County Data)
- Hypothesis: Weather Type has a correlation with Injury Severity
- Chi-Square Test Results:
- chi2 statistic: 129.35
- p-value: 1.1705e-13
- degrees of freedom: 32
- Conclusion
- It is clear that certain weather types have more accidents than others.
- We can also conclude that weather type does have a significant correlation with injury severity
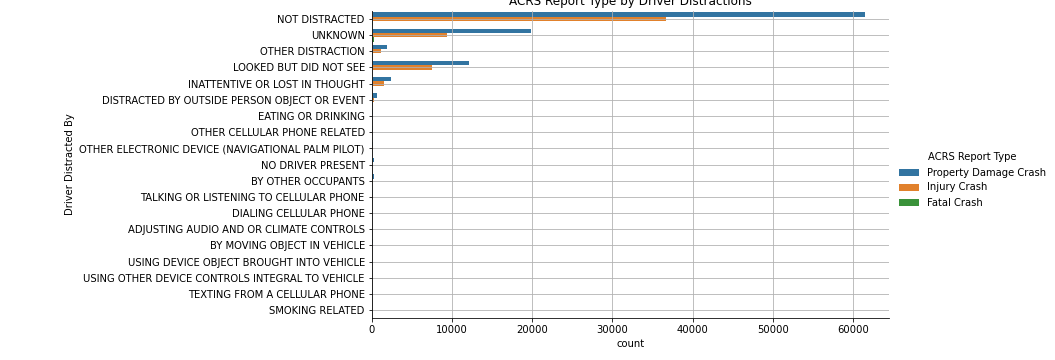
- Property damage crashes most common (63.34%)
- Not due to driver distraction (61.59%)
- Unknown if distracted (19.94%)
- Looked but did not see (12.09%)
- Injury crashes are second most common (36.41%)
- Not due to driver distraction (63.88%)
- Unknown if distracted (16.41%)
- Looked but did not see (13.03%)
- Fatal crashes are least common (0.25%)
- Unknown if distracted (69.97%)
- Not due to driver distraction (26.97%)
- Looked but did not see (1.78%)
- Conclusion?
- Majority of property damage and injury crashes were not due to driver distraction. More investigation into "unknown" category. Look into the driver's point of view during the accident.
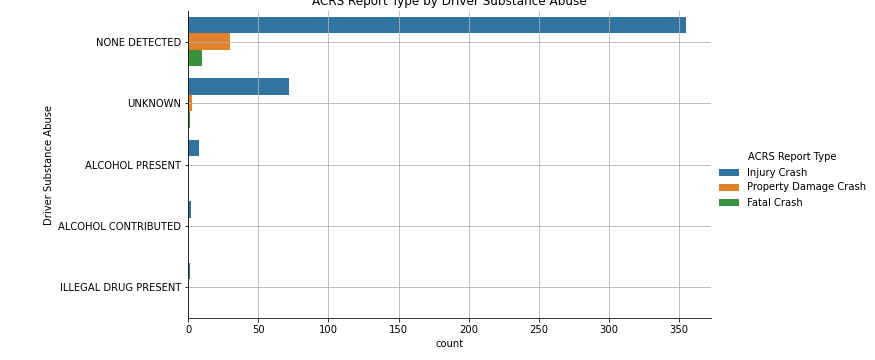
- 81.82% were tested for substance abuse
- Most drivers tested were involved in an property damage crash (62.90%)
- Most did not have drugs/alcohol detected (83.89%)
- Unknown if drugs/alcohol were detected (11.05%)
- Alcohol was present (3.36%)
- Injury crashes were the second most common (36.83%)
- Most drivers did not have drugs/alcohol detected (92.83%)
- Unknown if drugs/alcohol were detected (3.61%)
- Alcohol was present (2.19%)
- Fatal crashes were the least common (0.28%)
- Most drivers did not have drugs/alcohol detected (59.83%)
- Unknown if drugs/alcohol were detected (25.48%)
- Alcohol was present (7.48%)
- Conclusion?
- Majority of those tested for drugs/alcohol did not have any in their system. More investigation in the "unknown" category.
Hypothesis: A larger number of accidents occur around cities due to poor driving conditions and an
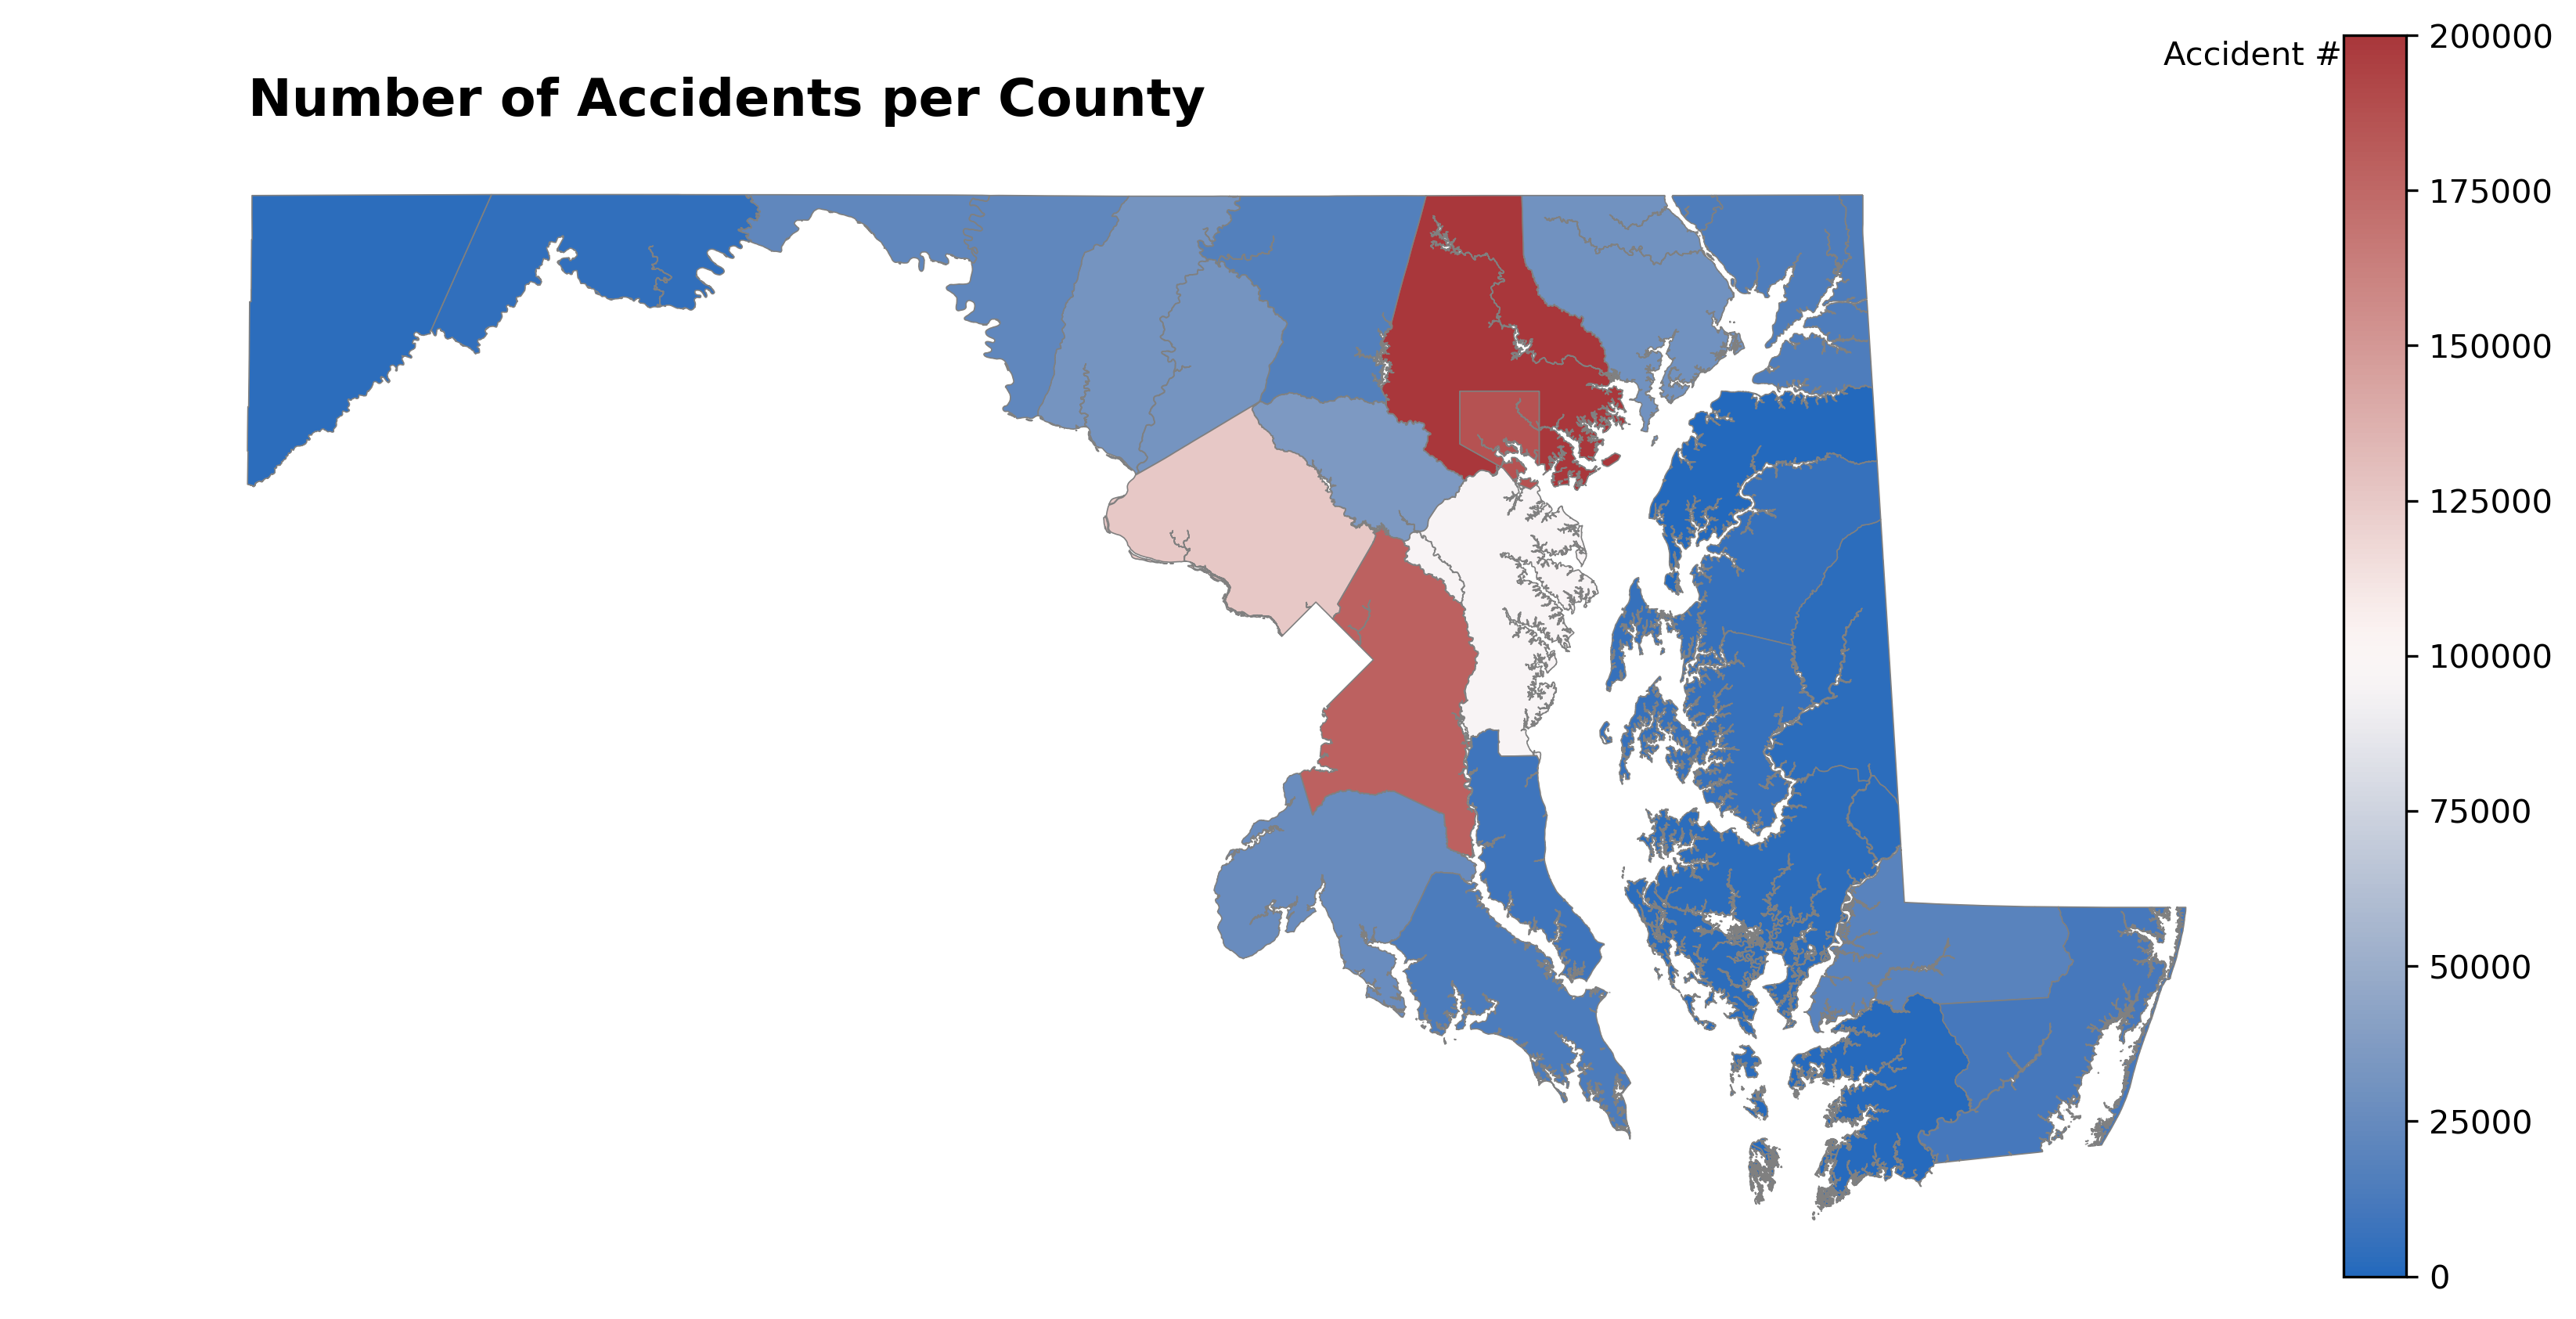
- Montgomery County is on the upper end of auto accidents in Maryland
- 102,078 accidents in the last 8 years
- The max number of accidents in the state was Baltimore County with 162,216 accidents
- 19 out of 24 counties in the state are below 50,000 accidents
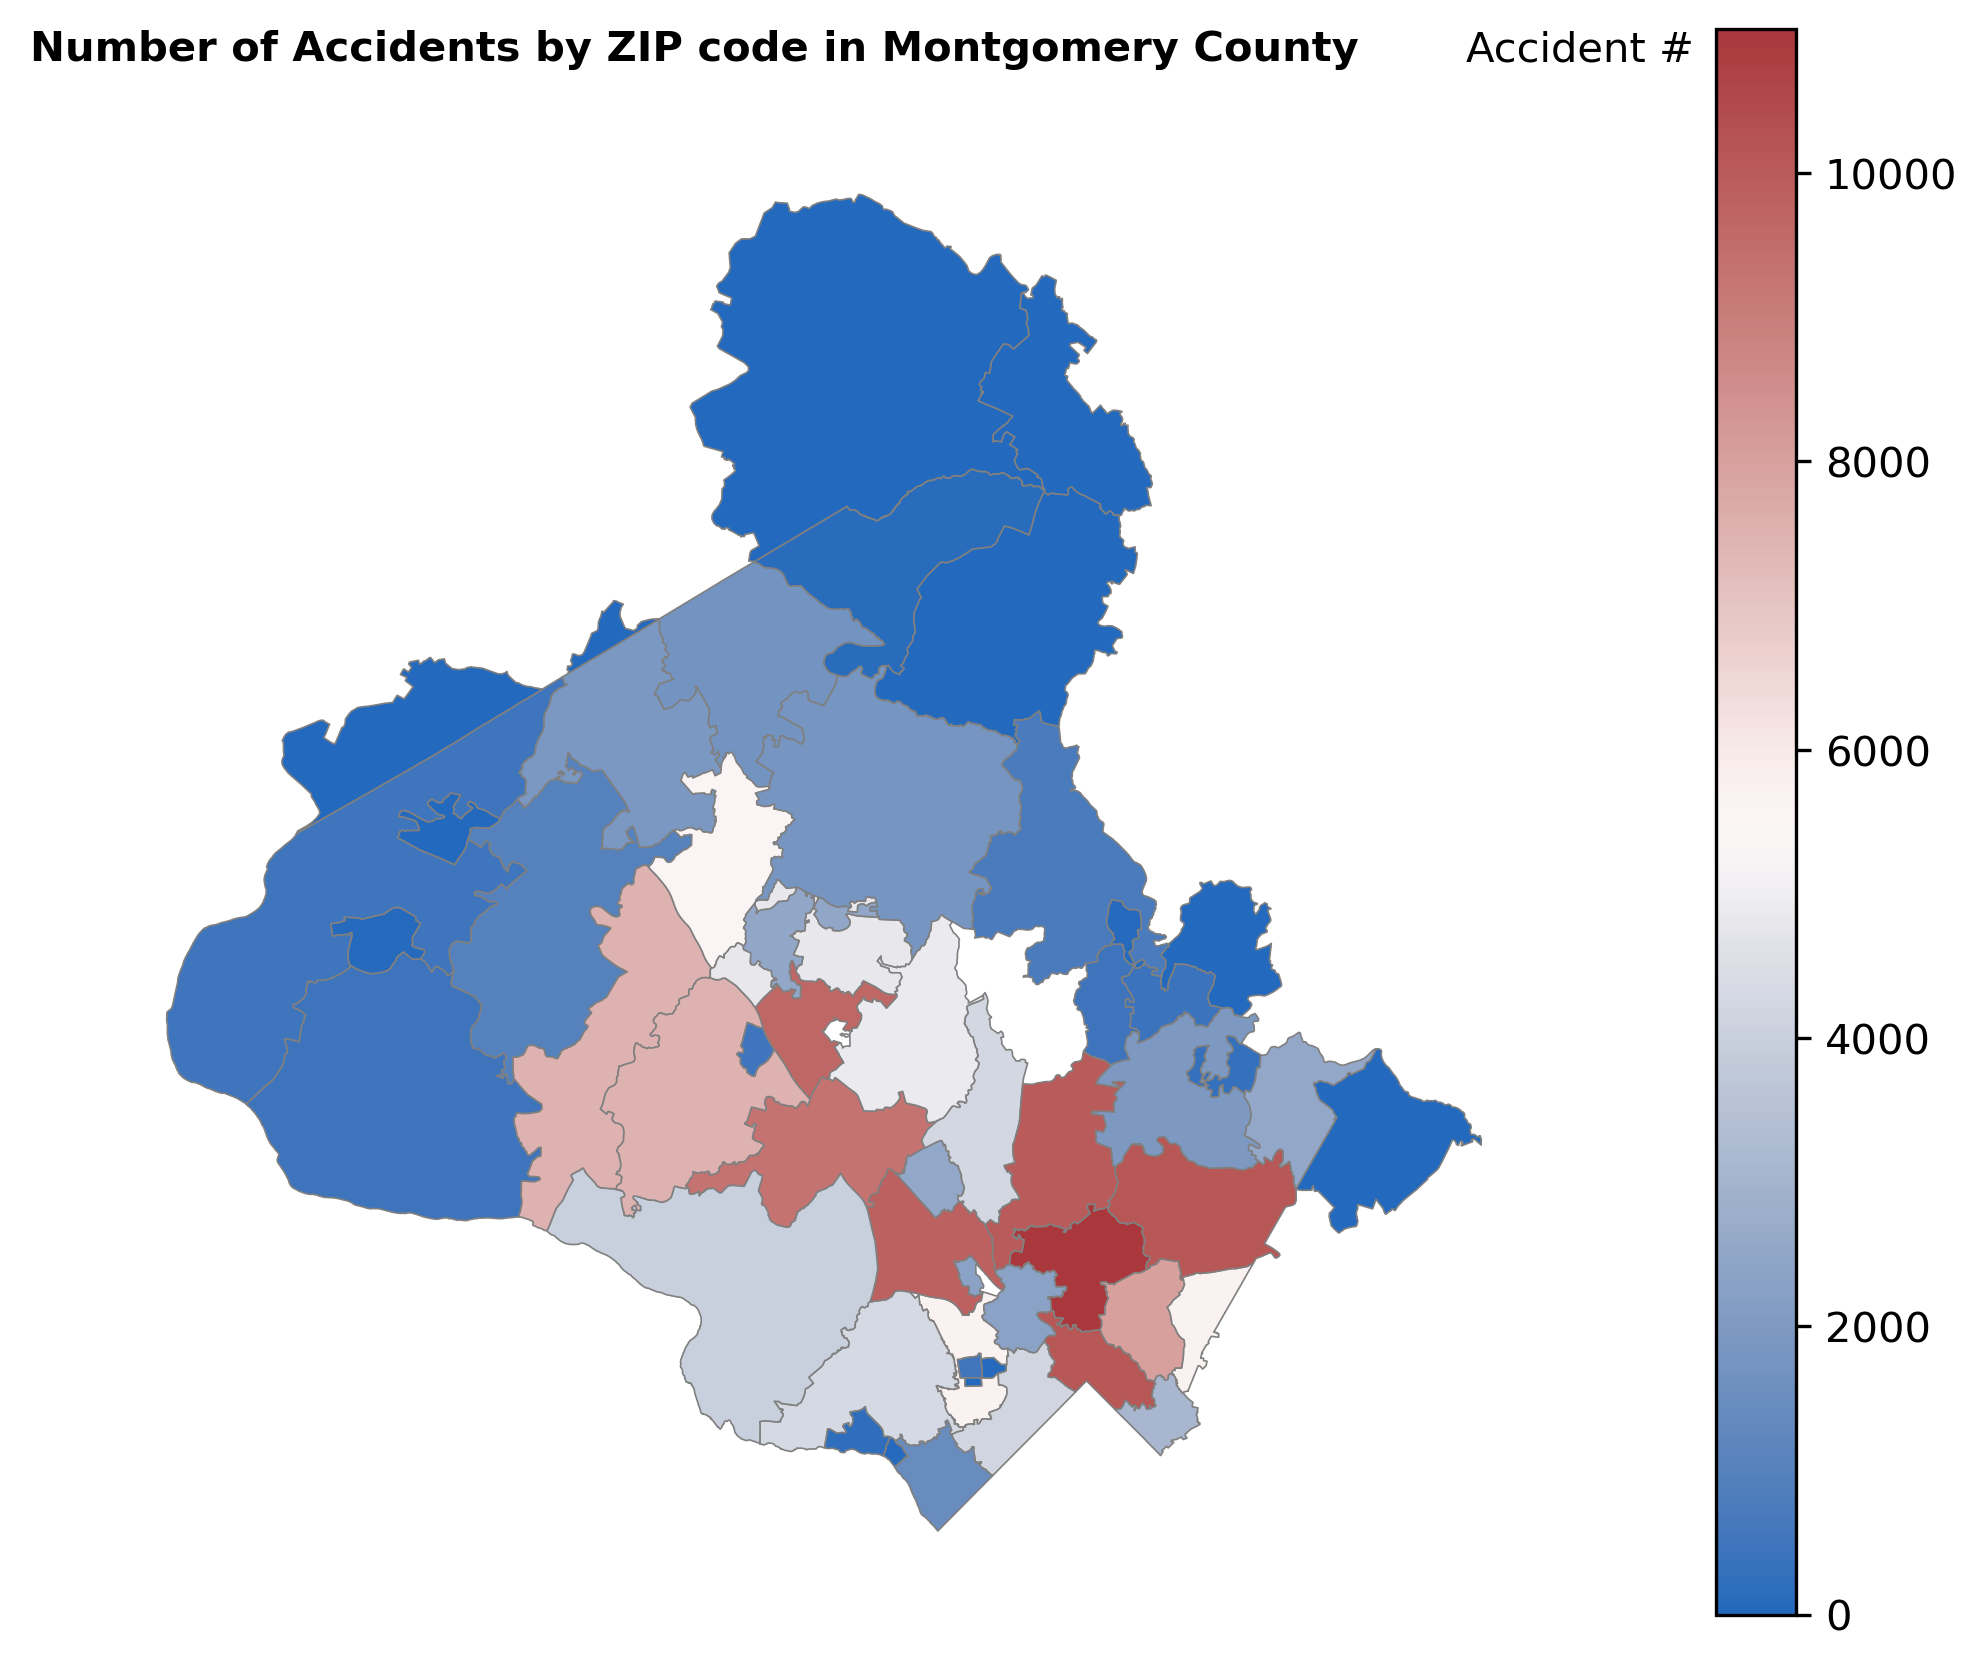
- Most of Montgomery County's auto accidents occurred in a condensed line through the county
- ~57% of all auto accidents in the county happened within just 10 zip codes
- Chi-Squared test
- Assuming an even distribution of accidents among counties and zip codes
- The P-value when comparing Maryland counties was 0.00
- The P-value when comparing Montgomery County zip codes was 0.00
- Conclusion
- It is clear that crashes occur more frequently in areas that are closer to a large city. However, more data from outside data sources would have to be used to understand why exactly these areas see more accidents.
-
Overlapping Data - repeated data that wasn't able to be separated during our data merge
-
Null Values - many of our original questions were void of supporting data, this made us change our questions to better fit things that we could analyze more accurately, if at all
-
Data Ranges - some data was non-overlapping in terms of timeline, therefore we only had one data source for some statistics and multiple for others
- Filter Data More Thoroughly - This would involve a more rigorous screening process to have a more reusable data set.