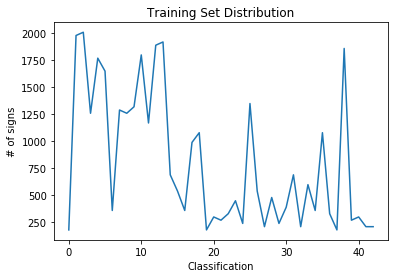
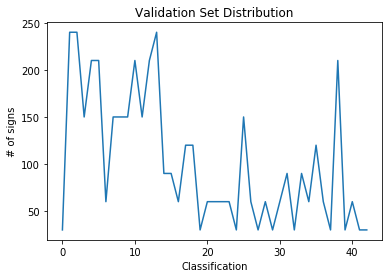
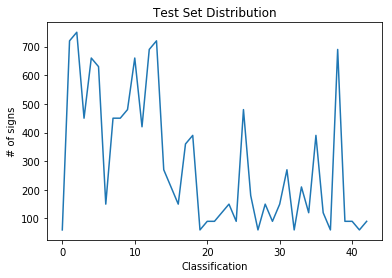
This project employs a convolutional neural network (CNN, or ConvNet) to classify images from the German Traffic Signs data set. The primary goals are to explore ConvNet architectures and deep learning approaches to machine image classification.
These are the summary statistics of the traffic signs data set (via numpy):
- Training set: 34799 images
- Validation set: 4410 images
- Test set: 12630 images
- The shape of a traffic sign image: 32x32x3 (32x32x1 grayscaled)
- The number of unique classes/labels in the data set: 43
Below are histograms showing the distribution of the training, validation, and test data sets across the 43 classifications, plotted via matplotlib.
The model architechture is based on the original LeNet architechure for 32x32 image classification and employs ConvNets to identify image features at both small and large scales. With minimal modifications and hyperparameter optimizations, LeNet achieved approximately 95% training and 89% validation accuracies.
To gain additional total accuracy, the output of both convolutional layers was fed into the first fully connected layer as suggested by Sermanet and LeCun, and the size of the fully connected layers was scaled up to match the much wider concatenated input. Accuracy on the training set improved dramatically but the validation accuracy remained low.
To combat overfitting, dropout was added to the fully connected layers with a keep probability of 0.5, and L2 regularization was added to the loss function with a multiplier of 0.01, later reduced to 0.005 to improve the fit.
The final model consists of the following layers:
| Layer | Description |
|---|---|
| Input | 32x32x3 RGB image (normalized to 32x32x1 grayscale) |
| Convolution 3x3 | 1x1 stride, valid padding: Outputs 28x28x6 |
| Activation | RELU |
| Max pooling | 2x2 stride: 14x14x6 output |
| Convolution 3x3 | 1x1 stride, valid padding: Outputs 10x10x16 |
| Activation | RELU |
| Max pooling | 2x2 stride: 5x5x16 output |
| Flattening | Concatenates layers 1 and 2: Outputs 1576x1 |
| Fully connected | Outputs 400x1 |
| Activation | RELU |
| Dropout | Keep probability: 50% |
| Fully connected | Outputs 120x1 |
| Activation | RELU |
| Dropout | Keep probability: 50% |
| Softmax | Maps to 43 classifications |
To preprocess the data, I grayscaled the images via summing the color channels and normalized the grayscale values to floating point values of +/- 1.0 with a mean of 0.
To train the model, I used TensorFlow's AdamOptimizer function over 50 epochs with a learning rate of 0.003 and batch size of 128. A high number of epochs and low learning rate were chosen to maximize the accuracy of the model. The softmax function was chosen to compute the loss, and one-hot encoding was used to compare the highest softmax probability with its correct classification.
My final model results were:
- training set accuracy of 98.3%
- validation set accuracy of 94.4%
- test set accuracy of 92.5%
Here are five German traffic signs that I found on the web:
The fourth image might be difficult to classify due to the tall shape and steep angle, while the second might present lesser difficulties due to the included watermarking.
Here are the results of the prediction:
| Image | Prediction |
|---|---|
| Go straight or right | Go straight or right |
| Roundabout mandatory | Roundabout mandatory |
| No entry | No entry |
| Speed limit (50km/h) | Keep left |
| Right-of-way at the next intersection | Right-of-way at the next intersection |
The model was able to correctly guess 4 of the 5 traffic signs, which gives an accuracy of 80%. Given this extremely small data set, the result compares favorably to the accuracy on the test set of 92.5%. The code for making predictions on my final model is located in the 89th cell of the Ipython notebook.
The four correctly classified signs have very high prediction certainties. For signs 2, 3, and 5, the model has an over 90% certainty that the images are roundabout (.926), no entry (1.00), and right-of-way (.993) signs. The prediction is slightly less certain for the first sign, as shown below:
| Probability | Prediction |
|---|---|
| .884 | Go straight or right |
| .060 | General caution |
| .031 | Road narrows on the right |
| .011 | Speed limit (70km/h) |
| .008 | Stop |
For the incorrectly classified fourth sign, the model has a low certainty overall. The correct sign was in the top three probabilities, but only with a very low certainty of .085:
| Probability | Prediction |
|---|---|
| .393 | Keep left |
| .328 | Wild animals crossing |
| .085 | Speed limit (50km/h) |
| .052 | Roundabout mandatory |
| .047 | Speed limit (30km/h) |


