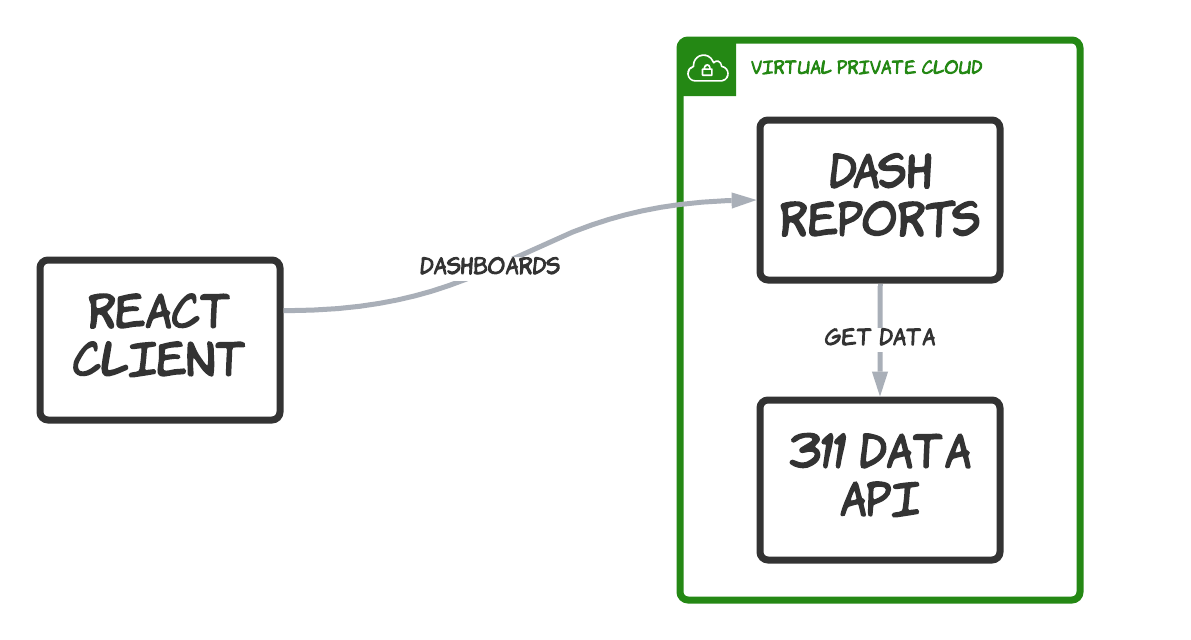
This is a proof-of-concept for a reporting system to be used in the 311 Data project. It uses Plotly Dash to create reports using Python that run interactively in a browser.
Creating reports with Dash has benefits:
- different layouts for each report
- fine-grained control over axes, grids, legends, etc.
- merge data from different sources
- leverage calculations and statistical tools
- use standard Pandas, Numpy and other python libraries
The main benefit however is the workflow.
With this approach we can have dedicated data analysts/scientists prototype reports in Jupyter notebooks using the Dash plug-in, get feedback/iterate, and package the report for inclusion in the app.
Changing reports, whether to fix bugs or respond to use feedback, no longer has to involve designers, frontend and backend developers running design, development and testing cycles. The data team should be able to control the report output themselves.
Dash runs in a container deployed to AWS Lightsail. It makes calls to the 311 Data API /reports endpoint to get aggregated data about service requests.
Dash runs server-based logic to generate UI components in React such as graphs and dropdown menus that the user can interact with.
It runs as a single embedded Flask app and routes requests to a specific report based on the query string. The reports themselves are self-contained single files with the data and layouts needed by Dash.
The reports themselves get data using a pandas get_json call to an API server, but any network-accessible data source can be used in reports.
Running the server locally is fairly straight-forward if you have Python 3.6+ installed.
- Clone the repo
- (Optional) Set up a virtual python environment (e.g. pipenv)
- Install dependencies with
pip install - Run
python index.py
In production, the server is intended to be run in a container with gunicorn workers. If you have Docker installed you can run it locally this way:
docker build .
docker run -p 5500:5500 dash-pocThere are many benefits to the report server architecture described above but they come with some new challenges. Having a separate standalone app for reporting provides flexibility but also introduces some integration problems that need to be mitigated.
- Need to figure out the best way to include reports in client: running them in an iframe seems the best solution
- Need to figure out how the client is aware of what reports are available: there is currently a file at
/static/dashboards.json - Need to see how closely the UI can match the designs and what UX may need to be adjusted: there is a stylesheet at
/static/report.css - Need to think about the best caching approach for both data and reports: currently the dashboards and associated data are loaded at startup or after being run and kept around in memory. A call to
/reloadwill reload all reports (it actually kills the worker which will get restarted)
