This project uses actual data from a Portuguese bank which uses a data driven approach to predict the success of telemarketing calls for selling long-term bank deposits.
You can read much more about this data (released to the UCI Machine Learning community) by clicking here
The data is related with direct marketing campaigns of a Portuguese banking institution. The marketing campaigns were based on phone calls. Often, more than one contact to the same client was required, in order to access if the product (bank term deposit) would be (‘yes’) or not (‘no’) subscribed. You can read more on the dataset by clicking here
bank client data:
- age (numeric)
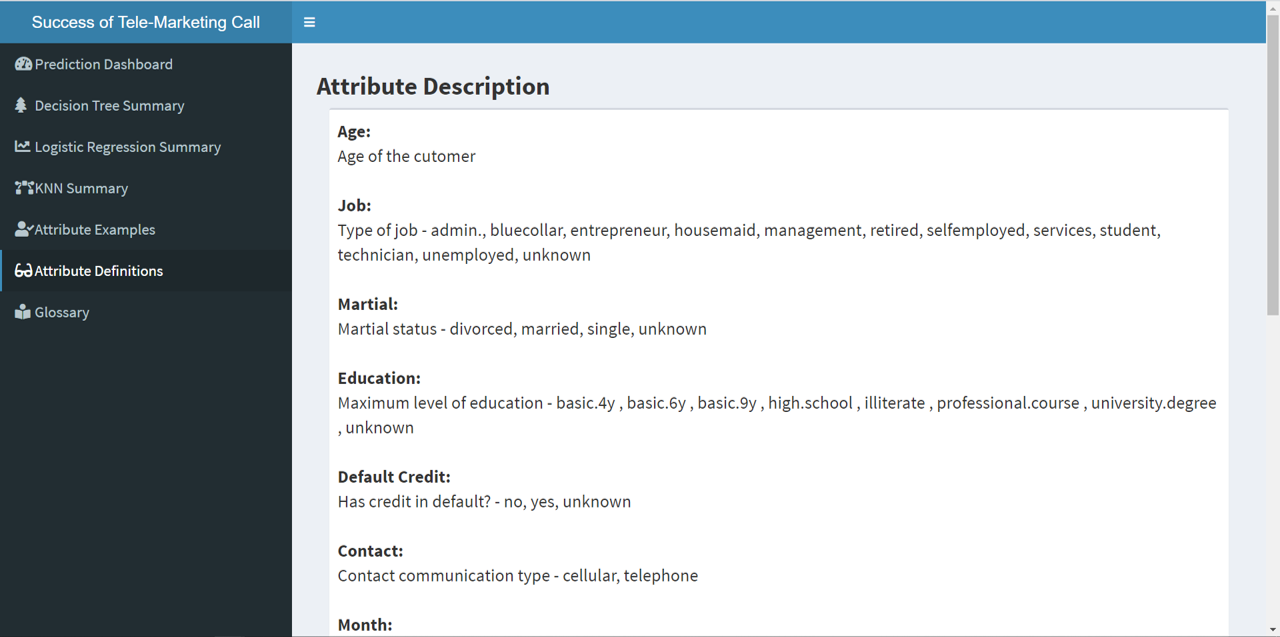
- job : type of job (categorical:‘admin.’,‘blue-collar’,‘entrepreneur’,‘housemaid’,‘management’,‘retired’,‘self-employed’,‘services’,‘student’,‘technician’,‘unemployed’,‘unknown’)
- marital : marital status (categorical: ‘divorced’,‘married’,‘single’,‘unknown’; note: ‘divorced’ means divorced or widowed)
- education (categorical: ‘basic.4y’,‘basic.6y’,‘basic.9y’,‘high.school’,‘illiterate’,‘professional.course’,‘university.degree’,‘unknown’)
- default: has credit in default? (categorical: ‘no’,‘yes’,‘unknown’)
- housing: has housing loan? (categorical: ‘no’,‘yes’,‘unknown’)
- loan: has personal loan? (categorical: ‘no’,‘yes’,‘unknown’)
related with the last contact of the current campaign:
- contact: contact communication type (categorical: ‘cellular’,‘telephone’)
- month: last contact month of year (categorical: ‘jan’, ‘feb’, ‘mar’, …, ‘nov’, ‘dec’)
- day_of_week: last contact day of the week (categorical: ‘mon’,‘tue’,‘wed’,‘thu’,‘fri’)
- duration: last contact duration, in seconds (numeric).
- Important note: this attribute highly affects the output target (e.g., if duration=0 then y=‘no’). Yet, the duration is not known before a call is performed. Also, after the end of the call y is obviously known. Thus, this input should only be included for benchmark purposes and should be discarded if the intention is to have a realistic predictive model.
other attributes:
- campaign: number of contacts performed during this campaign and for this client (numeric, includes last contact)
- pdays: number of days that passed by after the client was last contacted from a previous campaign (numeric; 999 means client was not previously contacted)
- previous: number of contacts performed before this campaign and for this client (numeric)
- poutcome: outcome of the previous marketing campaign (categorical: ‘failure’,‘nonexistent’,‘success’)
social and economic context attributes:
- emp.var.rate: employment variation rate - quarterly indicator (numeric)
- cons.price.idx: consumer price index - monthly indicator (numeric)
- cons.conf.idx: consumer confidence index - monthly indicator (numeric)
- euribor3m: euribor 3 month rate - daily indicator (numeric)
- nr.employed: number of employees - quarterly indicator (numeric)
Output variable (desired target):
- y - has the client subscribed a term deposit? (binary: ‘yes’,‘no’)
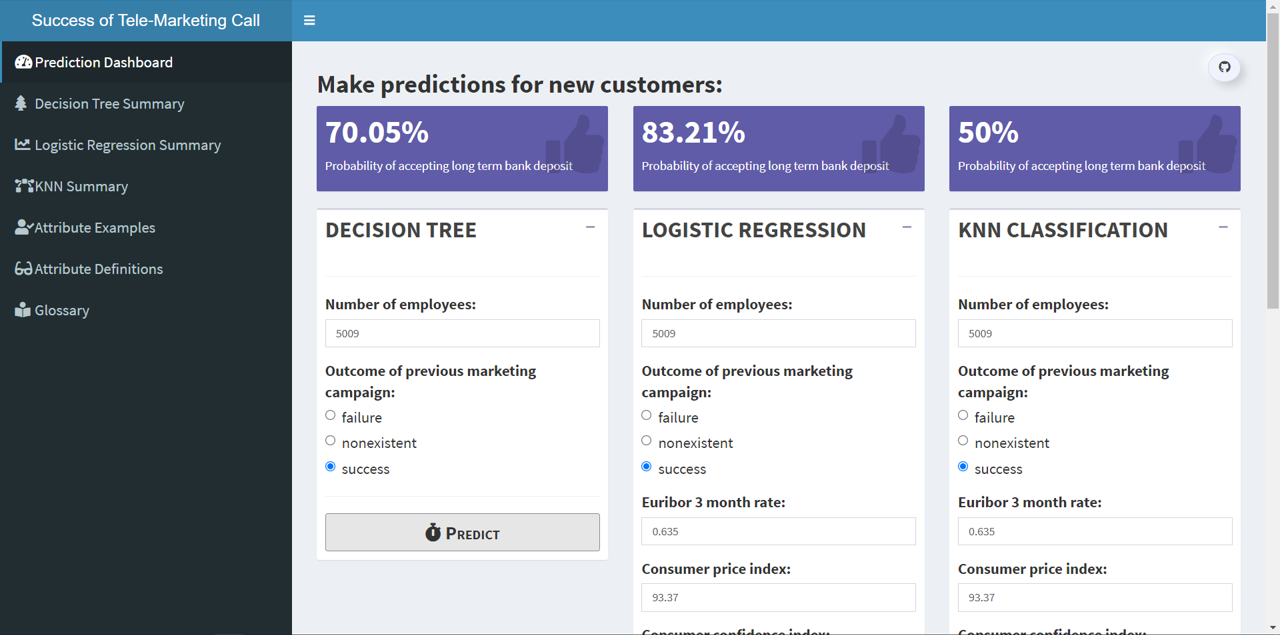
TO create a Data Science Dashboard or a Data Science web application product to be used in real-time by a salesperson.
The app would allow a salesperson to input the specific details of the customer they are talking to, and receive a prediction from each of the underlying models. Based on this prediction, the salesperson could make targeted offers to the customer in real-time. Thus, resulting in higher conversion ratios for the sales team.
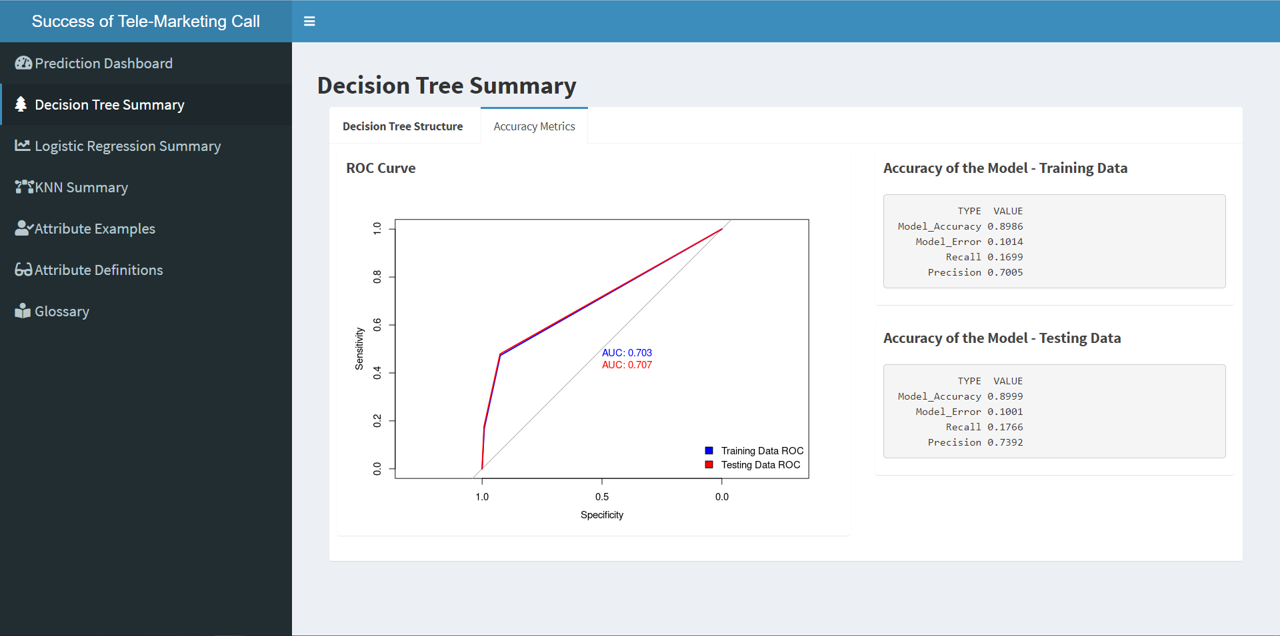
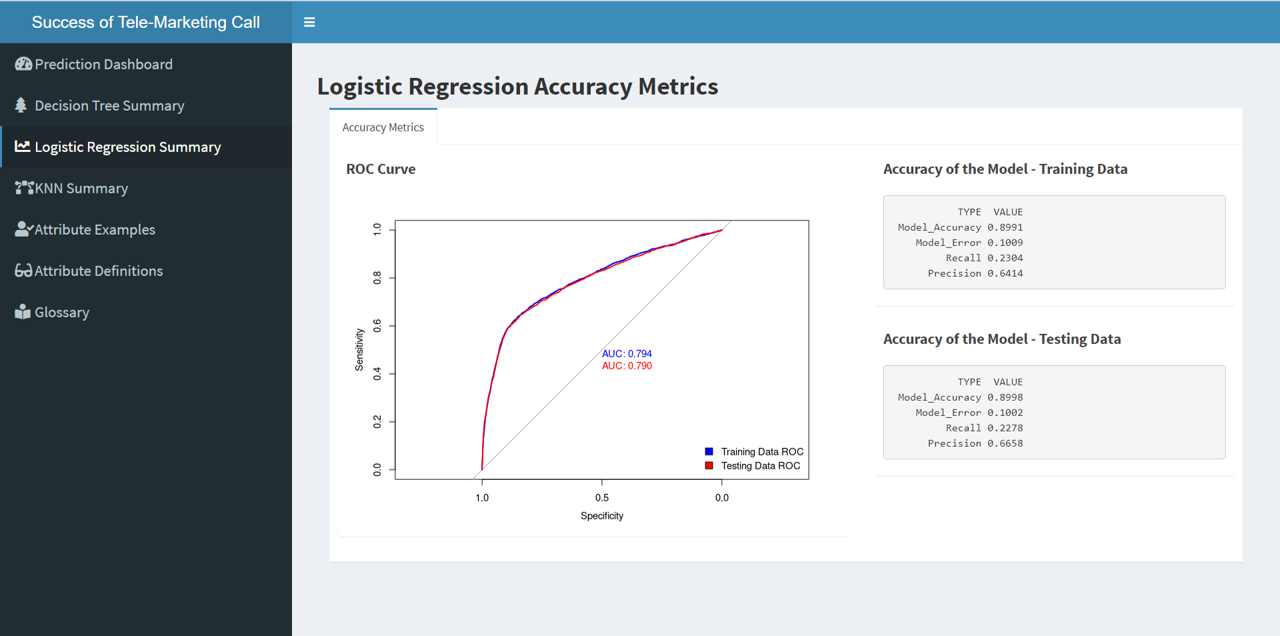
Our R Shiny Data Science dashboard uses following three Machine Learning algorithms to aid in decision making. The apps build the ML models and then for each model, it shows visualizations of the model and its fitness for purpose in the dashbaord.
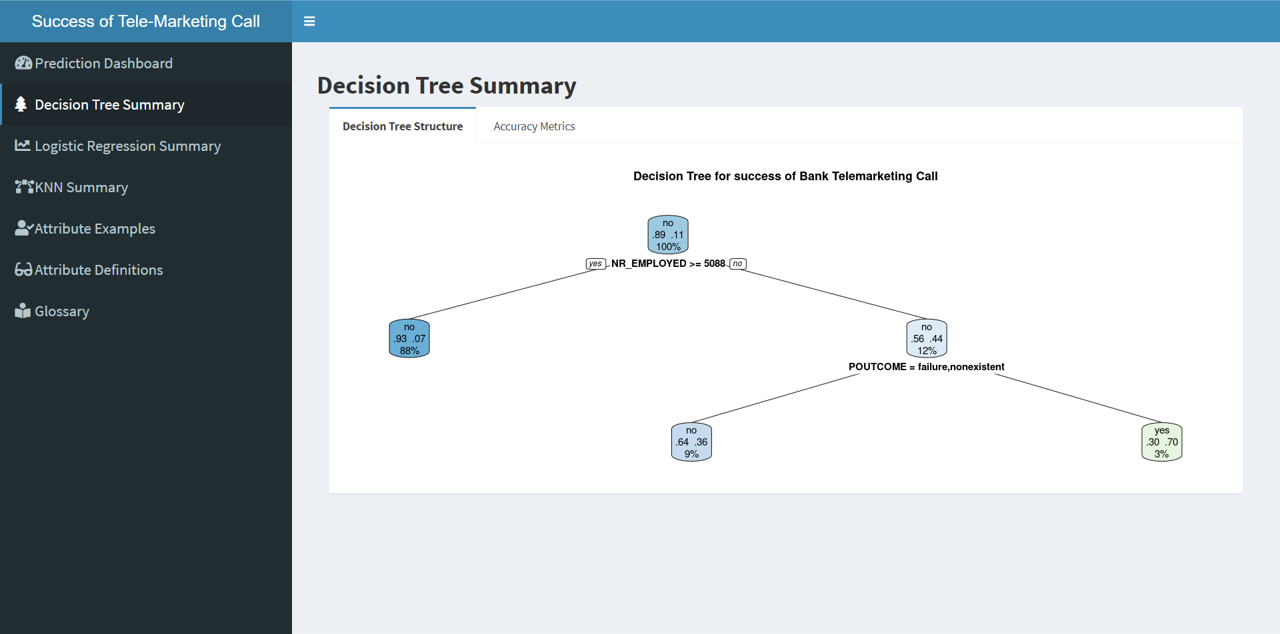
Create a decision tree which can predict class membership of the “y” variable. The final model used for the DT was decided after running the simulations on train and test data through multiple DT variations.
Logistic Regression helps to estimate of the probability that a given customer will respond. The goal is to create the best model we can to predict the probability a customer will take up the offer.
The marketing team will then use this model, and thus your probability estimate, to decide who to mail information out to. Clearly, the better the prediction, the less the cost of running the campaign.
Although Decision Trees and Logistic Regression models are good models to predict a user’s behaviour pattern. We go the extra mile by finding nearest similar users using knn classification to determine the probability that a given customer will take up the offer.
Thus, a sales person can read the probability from all the three models and change his/her loan offer accordingly in real time.
The Data Science dashbaord is deployed and live at shinyapps.io


