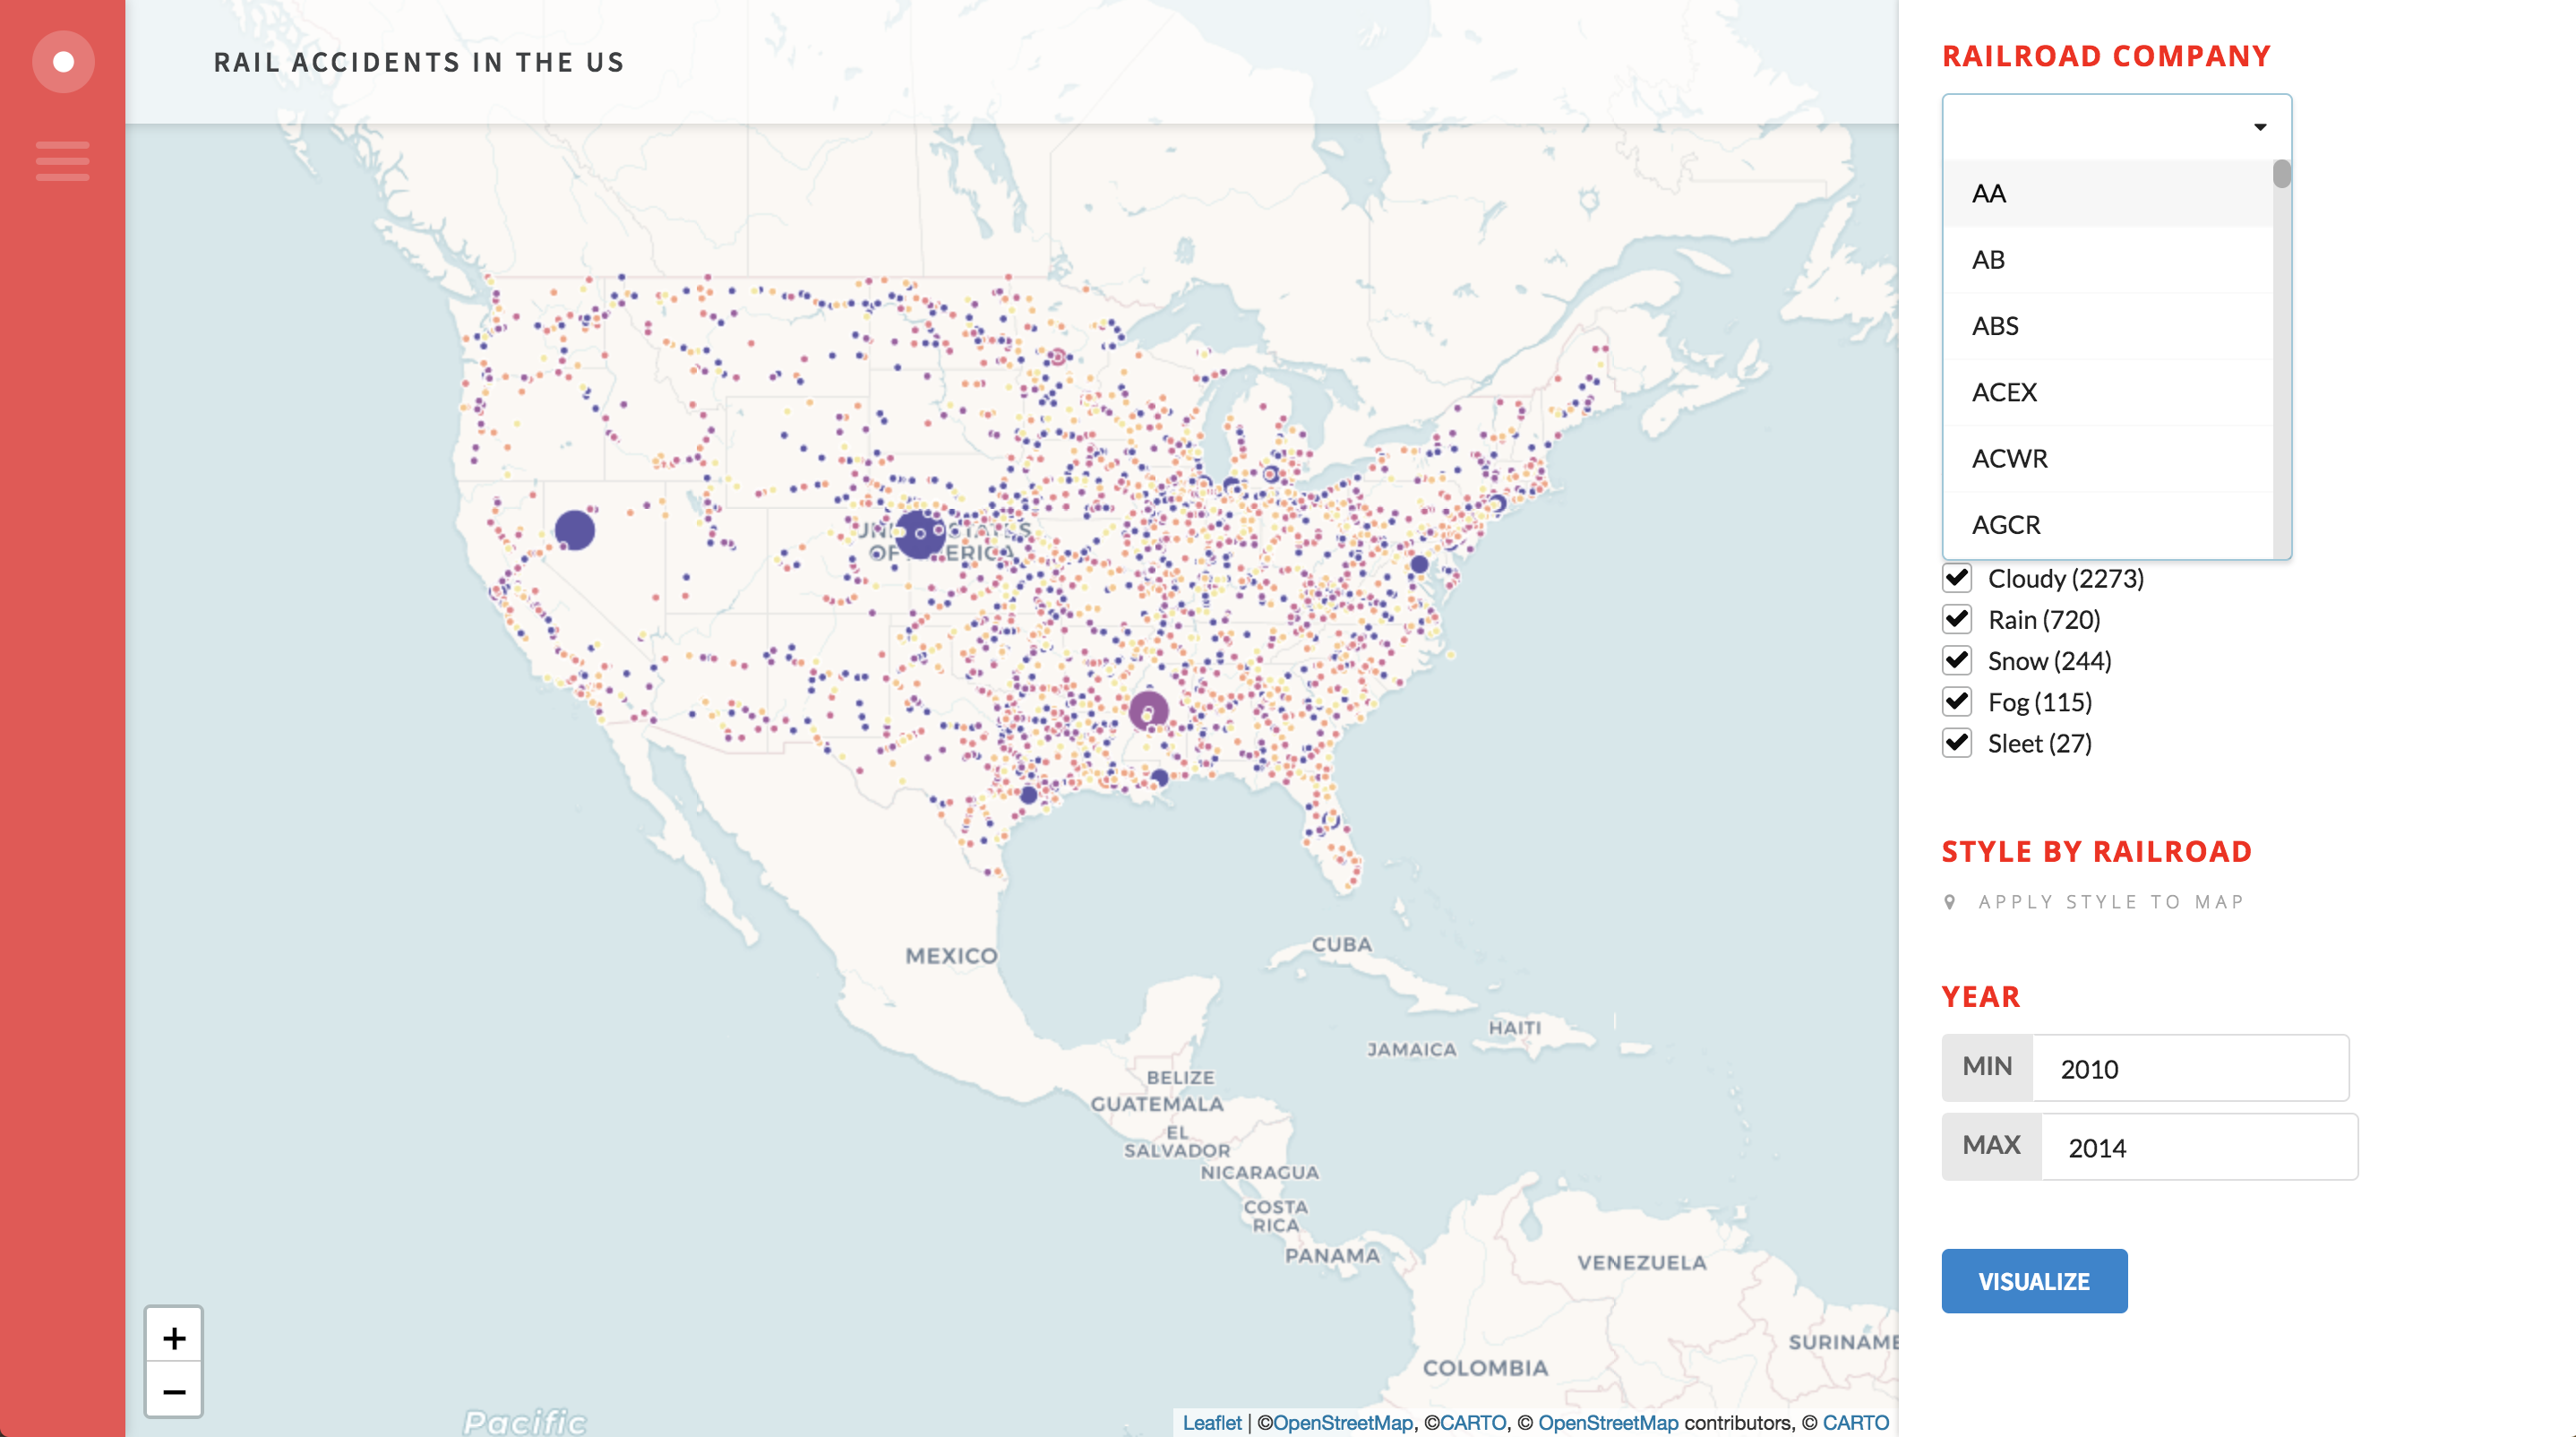
A simple Javascript library to rapidly develop geospatial applications with CARTO.js and Semantic UI. Easily create:
- Data driven dropdowns
- Data driven checkbox lists
- Layer controls
- Mix/max ranges
- Menus and data exports (including batch exports)
- Autostyle controls
- Simple inputs
And more.
Make sure you include the following libraries in your code:
You can use the rail.html file as a sample to get started.
After creating your layers, queries, and styles from CARTO.js, particularly the layer you want your widgets to interact with. For example:
var myQuery = new carto.source.SQL(query)First, add your credentials so you can use these to inform your widgets:
var creds = new accountCreds({
  apiKey: 'carto-apikey',
  username: 'carto-username',
  map: map
})var drop = new newDropdown({
credentials: creds,
id: 'div_id',
max: 5,
query: myQuery,
column: 'column_name',
table: 'table_name',
title: 'WIDGET TITLE'
})- max: Max number of entries you want to be selectable
- id: Unique div id for the dropdown
var checklist = newCheckboxList({
  credentials: creds,
  title: 'WIDGET TITLE',
  name: 'div_id',
  query: myQuery,
  dataset: 'table_name',
  column: 'column_name',
  aggregation: 'count'
})var range = rangeInput({
title: 'WIDGET TITLE',
credentials: creds,
name: 'div_id',
column: 'column_name',
query: myQuery
})var layer = new newCheckbox({
layer: layerName,
name: 'div_id',
credentials: creds,
label: 'Checkbox Label',
title: 'WIDGET TITLE',
checked: false
})var input = newInput({
title: 'WIDGET TITLE',
name: 'div_id',
placeholder: 'Placeholder Text',
min: 0,
max: 100,
start: 10
})var style = new autoStyle({
column: 'column_name',
layer: myLayer,
id: 'div_id',
title: 'WIDGET TITLE',
cartocss: `#layer {
marker-width: 10;
marker-fill: red;
marker-fill-opacity: 1;
marker-allow-overlap: true;
marker-line-width: 1;
marker-line-color: #FFFFFF;
marker-line-opacity: 1;
}`,
defaultCartocss: myStyle
})Control to add a custom slide out panel when clicking a map element.
myLayer.on(carto.layer.events.FEATURE_CLICKED, d => {

var sidebar = new sidebarInfo({
  layer: myLayer,
  content: `<h1> ${d.data.column_name} </h1>
    <h2>TITLE TEXT</h2>
    <p> ${d.data.column_name} </p>
    <h2>TITLE TEXT</h2>
    <p> ${d.data.column_name} </p>
    `
});
});var export = fileExport({
filename: "Filename",
credentials: creds,
query: myQuery,
format: "CSV"
})var batchexport = batchExport({
name: "WIDGET TITLE",
description: "Text space to describe what this export will do",
credentials: creds,
query: myQuery,
filename: "new_table_title",
format: "CSV"
})Currently, the map works by triggering a click event on a button to restyle the map and update all the existing widgets. This happens in the following code. To create the text needed for the query there are three functions:
- Text Query: Creates a string for a text query such as
state IN ('WI', 'MN', 'IL') - Range Query: Creates a string for ranges such as
year BETWEEN 2012 AND 2016 - Query Factory: Takes an array of query elements and assembles them into a final query which will update the map and widgets:
SELECT * FROM table_name WHERE state IN ('WI', 'MN', 'IL') AND year BETWEEN 2012 AND 2016
Below is a complete example of this implementation:
$("#button").mousedown(function () {

//Below is an example for a checkbox list - variable is the var name you assigned the checkbox list to

var checkboxes = textQuery({
    variable: checklist,
    column: "column_name"
  });

//Below is an example for a checkbox list - variable is the var name you assigned the checkbox list to

var range = rangeQuery({
    name: 'range',
    column: 'year'
});

var dropdown = textQuery({
    variable: drop,
    column: "school",
    dropdown: true,
    name: "test"
  });

var queryFinal = queryFactory({
  table: 'table_name',
  items: [checkboxes, range, dropdown]
})

myQuery.setQuery(queryFinal);

//console.log(queryFinal)

});- Pie Chart Widget
- Time Series Widget
- Complete text input functionality
- Style controls for elements in the maps (hovers, pop ups)
- Add auto style controls to relevant widgets
- Legends
- Freeform search
- Stacked info window tool (for multiple items at the same geometry location)
- Lasso tool
- Complete CSS Library
- Examples
- Options to modify the SELECT * FROM part of the query to do more in the map selections (for groupings and aggregations)
- Improvements to generating SQL statements in the widget
- Widget subtitles and descriptions
Are welcome. Or open an issue.
