Code to reproduce all analyses, tables, and figures in Accounting for motion in resting-state fMRI: What part of the spectrum are we characterizing in autism spectrum disorder?
-
To document the data loss and biases introduced by common motion exclusion practices in functional connectivity research
-
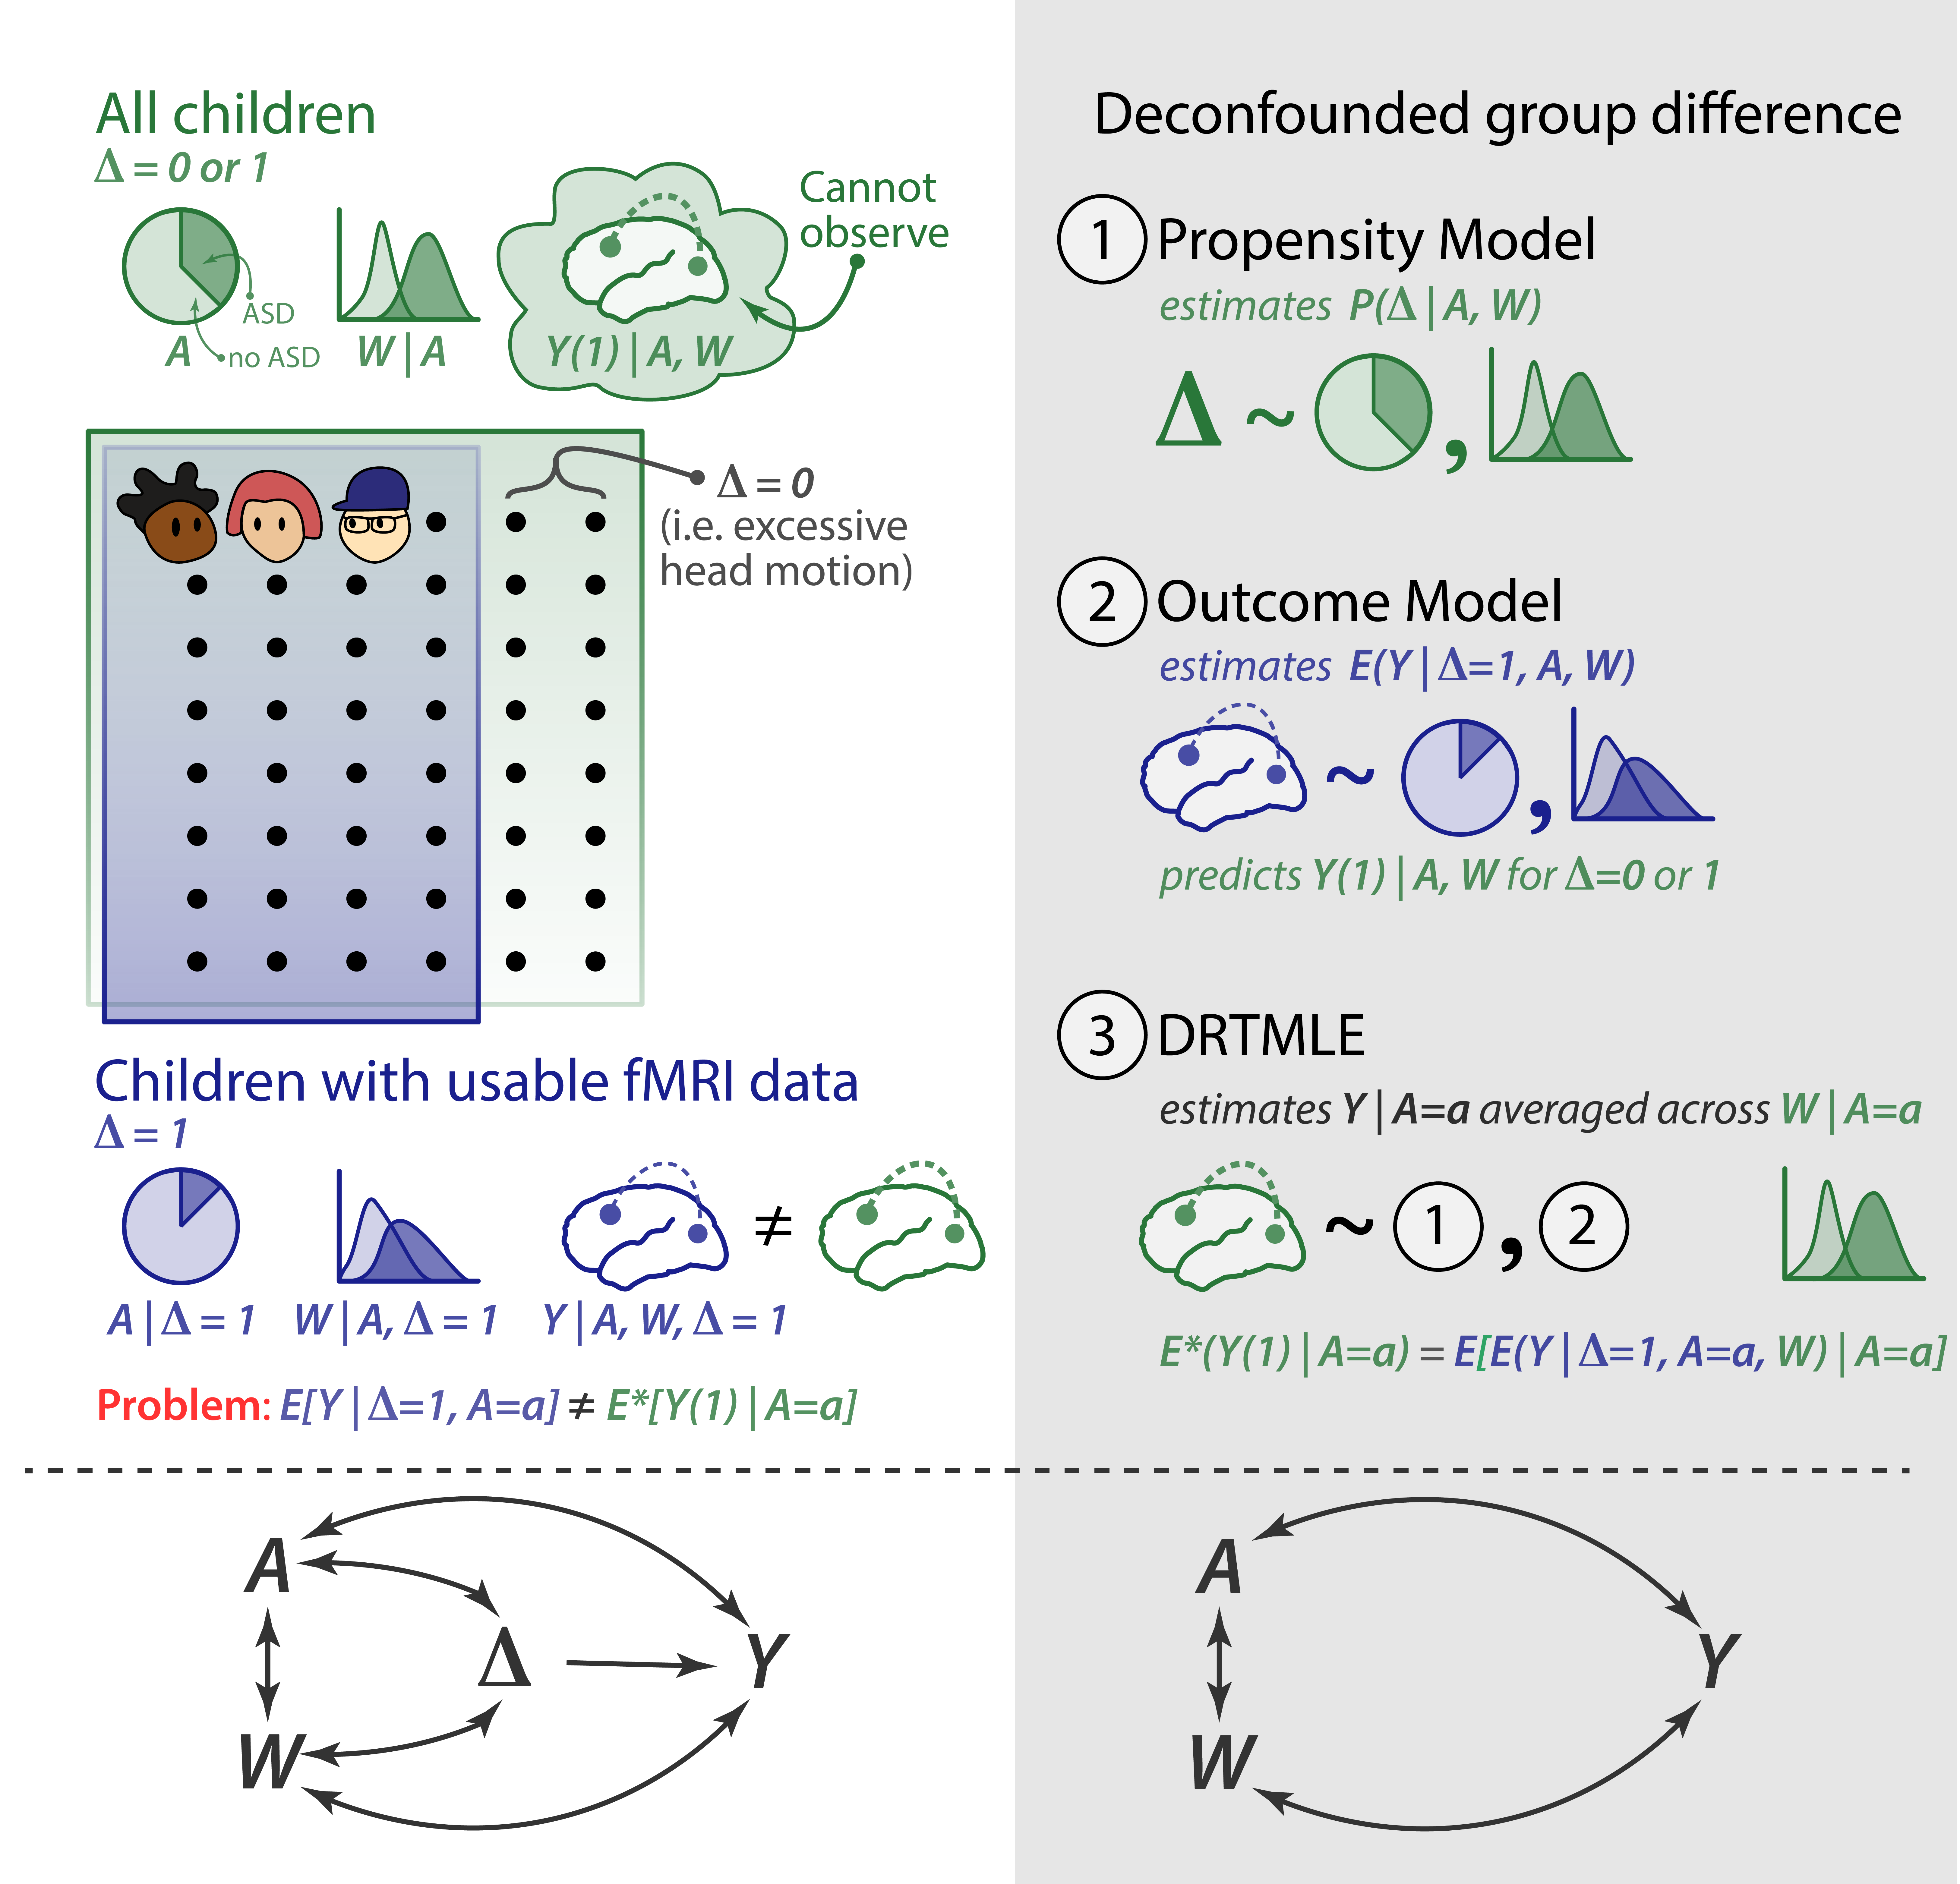
To introduce a framework to treat excluded scans as a missing data problem. We use doubly robust targeted minimum loss based estimation (DRTMLE) with an ensemble of machine learning algorithms to address these data losses and the resulting biases.
-
covariate_figures.Rmd- code used to run all analyses in sections 2.1.3 Study Sample to 2.2.4 Functional connectivity as a function of phenotypes. Outputs:- Table 1: Socio-demographic characteristics of complete predictor cases.
- Fig. S1: Missingness of socio-demographic and behavioral variables in the initial dataset.
- Fig 3: Motion quality control leads to dramatic reductions in sample size.
- Fig 4: rs-fMRI exclusion probability changes with phenotype and age.
- Fig S2: Univariate analysis of mean framewise displacement as a function of participant characteristics.
- Fig 5: Participants with usable rs-fMRI data differed from participants with unusable rsfMRI data.
- Table S1: Summary of Mann-Whitney U tests comparing included and excluded participants using the lenient motion QC and stratified by primary diagnosis.
- Table S2: Summary of Mann-Whitney U tests comparing included and excluded participants using the strict motion QC and stratified by primary diagnosis.
- Fig 6: Some covariates related to rs-fMRI exclusion probability are also related to functional connectivity.
-
DeconfoundedGroupDifference_Tutorial.Rmd- Tutorial described in Section 2.3.2. Toy example and tutorial, which simulates a variable Wc that drives the bias between data usability (Δ) and functional connectivity (Y) and then shows how DRTMLE can adjust for this bias. Output:- Fig. 2: Illustration of the improvement in functional connectivity from DRTMLE compared to the naive approach from a single simulated dataset.
-
QC_Impacts_Analysis_singleseed_noimputation_cb.R- R code to run the entire DRTMLE procedure for a single seed as described in section 2.3.2 Application: Deconfounded group difference in the KKI Dataset. This includes estimation of the propensity model (same for each edge), estimation of 153 outcome models, and application of DRTMLE to estimate the deconfounded mean for the ASD group, the deconfounded mean for the typically developing group, and their variances for 153 functional connectivity edges. -
QC_Impacts_loopSeeds.sh- Loops through seeds, creates a copy of QC_Impacts_Analysis_singleseed_cb.sh, and replaces "seedID" with a numeric value. -
Run_DRTMLE_ToyAndApplication_Analyses.Rmd- uses ezspin and ezknit to run remaining analyses:QC_Impacts_Analysis_RtoR_comparetosimulateddata.R: compares data simulated in the tutorial to the real dataQC_Impacts_Plots_PropensitiesOutcome.R: calculate the correlation between the mean ASD-TD z-statistic from DRTMLE for the two sets of 200 seeds, to compare the number of significant edges indicated by DRTMLE for the two sets of 200 seeds, to calculate Cohen's D for the naive ASD-TD differences, to plot the modified partial correlations, naive means, and DRTMLE means for the nine components with the smallest DRTMLE p-values, and to visualize the missingness of the initial dataset. Outputs:- Fig. S4: Plots of modified partial correlations, naive means, and DRTMLE means for the nine components with smallest DRTMLE p-values.
QC_Impacts_DRTMLE_Table_CirclePlotsWhiteBG.Rmd: remove black background from screenshots of the 18 signal components saved in [Mango] (http://ric.uthscsa.edu/mango/), average DRTMLE group means, group differences, and z-statistics across all 400 seeds. Outputs:- Fig. 7: The DRTMLE deconfounded group difference revealed more extensive differences than the naıve approach.
- Fig. S3: Comparison of edges showing a group difference using the naive and DRTMLE approaches at FDR=0.05.
- Table S3: Summary of edges for which DRTMLE indicated a group difference at FDR=0.20.
