Machine Learning 4 the Search for Extra Terrestrial Intelligence (http://www.seti.org/ml4seti)
This page has been updated to reflect that the June 1 - July 31, 2017 code challenge has completed. While the official code challenge is over, we will keep the data sets, test sets and scoreboards available for those that are interested in posting scores for fun.
If a team or individual manages to post a score to the Final scoreboard that beats the code challenge winner, we would be very interested to learn how those results were achieved.
In order to view this repository in its state on July 31, 2017 at the conclusion of the code challenge, please browse at tag 1.1.0.
The ibmseti Python package is useful to read the simulated data sets in this code challenge (as well as the
real SETI data availabe via the SETI@IBMCloud project).
Version 1.0.5 supports only Python 2.7 and is the still the latest stable release. It can be installed with pip install ibmseti.
Version 2.0.0.dev5 supports both Python 2.7 and 3.5. You can install this by explicitly stating the version number pip install ibmseti==2.0.0.dev5
The SETI Institute hosted a public hackathon and global, online code challenge from June 1, 2017 to July 31, 2017. The goal was for citizen scientists to find a robust signal classification algorithm for use in the mission to find E.T. radio communication. By framing the radio signal data as a spectrogram (a 2D visual representation), we can convert the problem into an image classification problem. Participants built machine learning and deep learnng / AI techniques to construct highly accurate classification systems that very successfully classified the signals in our simulated data set. We'd like to thank everybody who participated.
The Winning Team was Effsubsee. They posted a classification accuracy of 94.99%. In second place was Signet, which a classification accuracy of 94.67%!
You can read more about the neural-network architectures these teams employed:
Instructions for installing the necessary software to run these models are found here.
Additionally, two Jupyter notebooks (tested to work on IBM Data Science Experience) demonstrate these models:
Each night, using the Allen Telescope Array (ATA) in northern California, the SETI Institute scans the sky at various radio frequencies, observing star systems with known exoplanets, searching for faint but persistent signals. The current signal detection system is programmed to search only for particular kinds of signals: narrow-band carrier waves. However, the detection system sometimes triggers on signals that are not narrow-band signals (with unknown efficiency) and are also not explicitly-known radio frequency interference (RFI). There seems to be various categories of these kinds of events that have been observed in the past.
Our goal is to classify these accurately in real-time. This may allow the signal detection system to make better observational decisions, increase the efficiency of the nightly scans, and allow for explicit detection of these other signal types.
The standard approach to SETI signal detection and classification is to transform the observed radio signals, which are time-series data, into a 2-dimensional representation called a spectrogram. A spectrogram is a measure of the power of the signal across a range of frequencies, as a function of time. From this, the data acquisition software searches for narrowband signals. By displaying the spectogram as a 2D image, this transform the problem into a visual recognition problem.
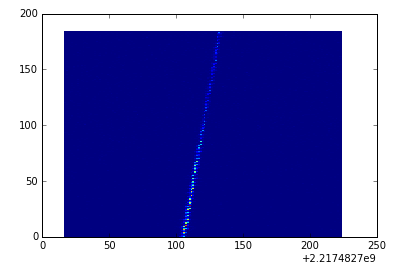
For example, here is a classic narrowband signal observered from the ISEE3 explorer. These are the kinds of signals the software is tuned to identify.
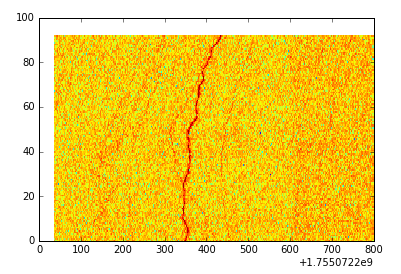
But things are usually never that pretty unless we're looking at a spacecraft. Here's another example: a mysterious squiggle observed in 2014 (the color scale is different because the power amplitude, coming out of the page is on a log-scale).
Similar to the signal above, we often see various signal types that our software is not specifically designed to detect. These have various names like "squiggles", "pulsed", and "bright pixels".
We want to build classification models that are designed to find these "other" types of signals. We hope to utilize the expertise from the data science community and simultaneously allow a way for citizen scientists to get involved in research that is normally out of their reach. We want to increase the number of large cups in the water, as Dr. Jill Tarter might describe it.
The challenge is to build a classification system based on a large body of simulated (and labeled) data that we have constructed. While our set of simulated data does not span the full range of types of signals observed at the ATA, or the complexity, it is a good starting point for building useful classification tools.
The Getting Started page will show you how to download the data, read the data into spectrograms, extract features (if you wish) and pass the spectrogram to various classification tools, such as IBM Watson Visual Recognition or a neural network using TensorFlow.
You may also wish to start with one of the models produced by the teams listed in the Introduction.
The Judging Information notebook will explain how to build a scorecard to be submitted to the Preview Scoreboard. You can submit up to 10 entries to the Preview Scoreboard.
There is also a Final Scoreboard, to which you can submit just one entry!
The scoreboards contain scores from the code challenge -- can you beat them?!
The Preview Test Set key (UUID, class label pairs) is now available in this repository, along with some sklearn code that will
produce the LogLoss score, confusion matrix and classification accuracy scores for you. There is a jupyter notebook and files in the results folder to get you started.
To facilitate team-building and communication we have created a Slack team that you may join.
Sign up for the Slack team here.
The SETI Institute has been partnering with IBM for almost two years now. We've done amazing work together and have written about it in various places. Please check it out.
- SETI Talk at Seattle Galvanize by Adam Cox
- SETI@IBMCloud: SETI data, publicly available, from IBM
- SETI sparks Machine Learning to sift Big Data
- Types of Big Data from the Allen Telescope Array
- Signal Classification: Powerful Patterns from Simple Features
- IBM and Stanford University team up for a new perspective on SETI signal analysis
- Status Update from the SETI Institute
- The SETI Project Team

