Helper functions for event history analysis with the survival package.
Install from GitHub repository.
library(devtools)
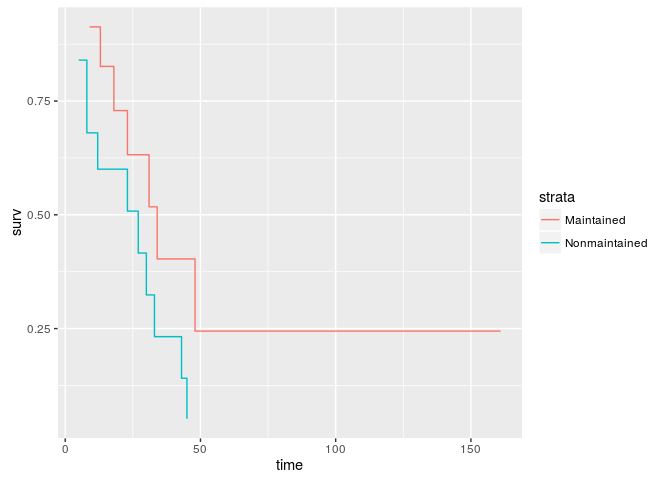
install_github('junkka/ehahelper')Make a data.frame of a survfit or coxph object for visualization with ggplot2.
library(ehahelper)
library(survival)
library(ggplot2)
surv_object <- coxph(Surv(time, status) ~ strata(x), data = aml)
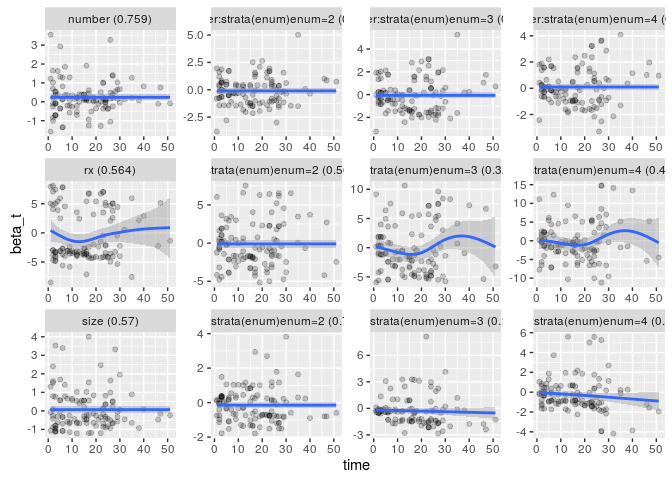
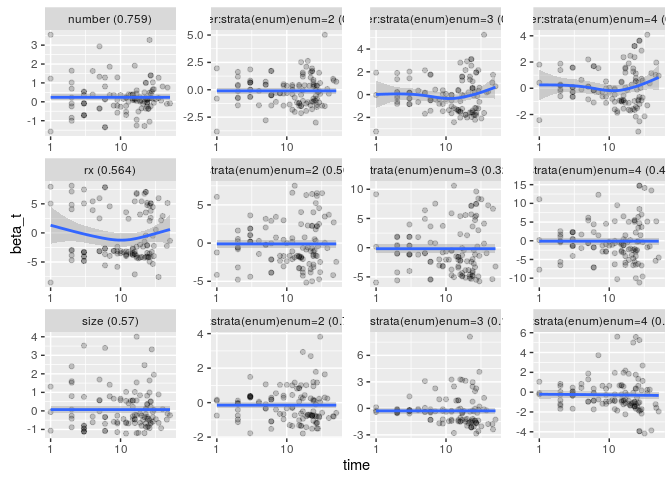
ggplot(ggsurv(surv_object), aes(time, surv, color=strata)) + geom_step()ggplot2 implementation for visualizing scaled Schoenfield residuals form a cox.zph object.
bladder1 <- bladder[bladder$enum < 5, ]
fit <- coxph(Surv(stop, event) ~ (rx + size + number) * strata(enum) +
          cluster(id), bladder1)
x <- cox.zph(fit, transform = "identity")
gg_zph(x)
## `geom_smooth()` using method = 'loess'
gg_zph(x, log = TRUE)## `geom_smooth()` using method = 'loess'
Convert coxme objects to tidy format.
library(broom)
library(coxme)
fit <- coxme(Surv(y, uncens) ~ trt + (1|center), eortc)
knitr::kable(tidy(fit, exp = T), digits = 3)| term | estimate | std.error | statistic | p.value | conf.low | conf.high |
|---|---|---|---|---|---|---|
| trt | 2.031 | 0.064 | 11.03 | 0 | 1.791 | 2.304 |
fit_g <- glance(fit)
knitr::kable(as.data.frame(t(fit_g)), digits = 3)| V1 | |
|---|---|
| n | 2323.000 |
| events | 1463.000 |
| Chisq | 236.110 |
| df | 2.000 |
| logLik | -10478.839 |
| p | 0.000 |
| AIC | 21015.051 |
| BIC | 21166.750 |
| random_n_center | 37.000 |
| random_sd_center | 0.329 |
| random_variance_center | 0.108 |
Using a coxme model, add fitted values and standard errors to original dataset.
eortc_augmented <- augment(fit, eortc)

knitr::kable(head(eortc_augmented))| y | uncens | center | trt | .fitted | .se.fit | |
|---|---|---|---|---|---|---|
| 2 | 506.1603 | 1 | 1 | 1 | 0.2037681 | 0.0184739 |
| 3 | 294.3800 | 1 | 1 | 1 | 0.2037681 | 0.0184739 |
| 4 | 383.9152 | 1 | 1 | 0 | -0.5048446 | 0.0457700 |
| 5 | 2441.8338 | 0 | 1 | 0 | -0.5048446 | 0.0457700 |
| 6 | 2442.2923 | 0 | 1 | 0 | -0.5048446 | 0.0457700 |
| 7 | 312.3571 | 1 | 1 | 1 | 0.2037681 | 0.0184739 |
Get predicted vales based on a mixed-effects Cox model, fitted using the coxme package. Extends the standard predict.coxme function by allowing for new data, and by calculating relative risks, either overall or within stratum.
new_data <- data.frame(trt = unique(eortc$trt))

predict_coxme(fit, newdata = new_data, type = "risk")
## 1 2
## 1.2260138 0.6035994


