Python learning and discovery journal, whilst producing a semi-useful software.
Show and Tell, 15/04/2020 for the UL Computer Society. This is more to show my mindset as I was going through this rather than actually producing an amazing piece of software at the end. [even though it is amazing :)]
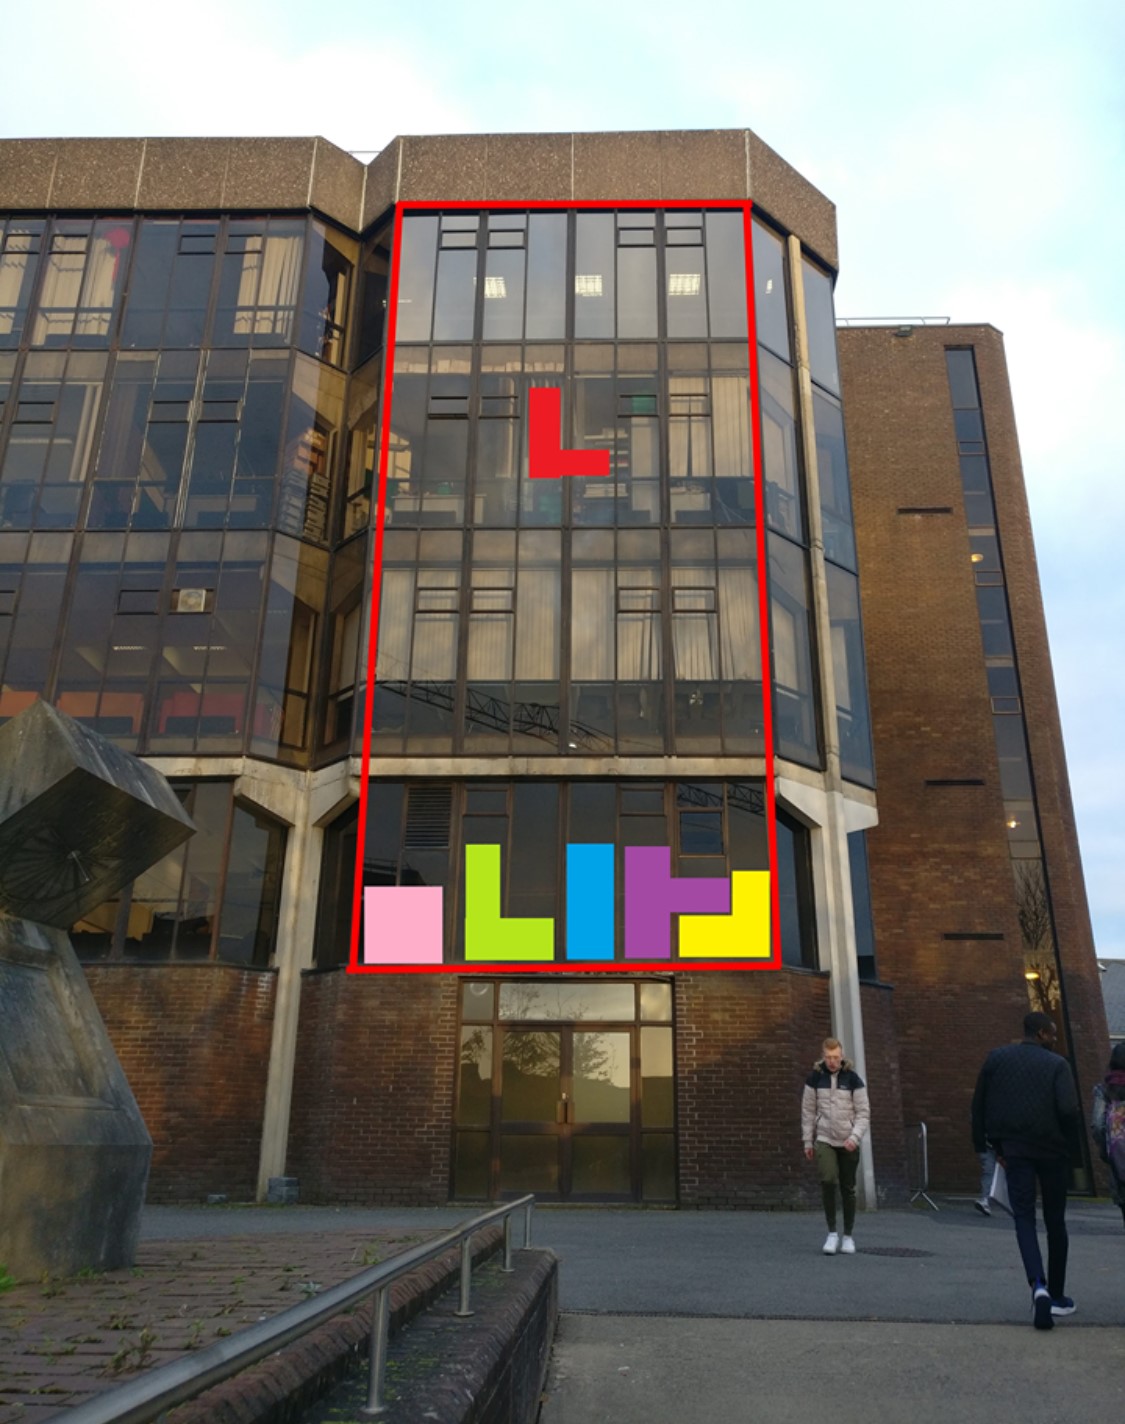
As you can see from the image below this is what a project to use a new different style of media sharing would look like. You could play games like tetris, you could use block text to write messives or create pixel art movies and stream them to the wall.
In the finished project there would be light panels behind each section of the windows and they could be controlled remotely to turn on and off and display colours on demand.
Eventually my thought process turned to how are you going to have someones idea for a image or movie and convert that into what you see on the wall. I always liked the idea of Paint, MSPaint had my attention for a lot of my childhood. So I wanted to create something like Paint but for drawing block art that could be used for the project of controlling a wall of light.
I wanted to create a grid that had the grid co-ordinates of each light panel for the full UL lighting up a wall face project. To do this I created a program that accepted two inputs from the terminal, width,height and it prints out the co-ordinates starting from 0,0 up to whatever. It does it in two ways having the origin in the top left and the traditional origin starting point at bottom left.
The file is Link to the code, coords-cli.py
> Enter Grid Width and Height(Integer)(Use the comma): w,h 3,5
: 0,0 : 0,1 : 0,2 :
: 1,0 : 1,1 : 1,2 :
: 2,0 : 2,1 : 2,2 :
: 3,0 : 3,1 : 3,2 :
: 4,0 : 4,1 : 4,2 :
----------------
: 5,0 : 5,1 : 5,2 :
: 4,0 : 4,1 : 4,2 :
: 3,0 : 3,1 : 3,2 :
: 2,0 : 2,1 : 2,2 :
: 1,0 : 1,1 : 1,2 :
: 0,0 : 0,1 : 0,2 :
I already had a graph created from a previous project using matplotlib to graph two streams of values. I thought maybe I can just plot points on the graph and use this in some way.
So I went ahead and modified it to only display points on a graph. My idea was each point would be a light turned on. (I realised quickly after this wouldnt work.) Scatter plot representing each light point
After my realisation matplotlib wouldnt work for my needs I remembered all of my Java lectures of drawing squares and shapes through the code and thought, Hey I can do this on Python. Did a search of the web "Draw a rectangle on pygame". Sure enough I found StackOverflow and found the right direction with PyGame.
I modified the code in the link along with the logic from the code higher up on coords_cli.py to draw multiple rectangles on a graph. Code that prints a few rectangles in the shape of the UL lighted up wall
I wanted to create a modified version of paint that only has blocks. So I need to know how Paint programs work in order to create a different one. Again back to searching and I found a YouTube video with source code included. This is a Paint program created in PyGame by a 14 year old.
I want a modified paint program not a paint program. Removing one feature from the program is hard but its a great way to learn about the overall program. I removed stickers and I removed the eraser and other features. Modified Paint program, paint.py
You remember above when I mentioned I created my first PyGame rectangles, well after learning a few things from paint.py I learnt about PyGame colors, PyGame clicking events and the PyGame collission detection functions.
Once again the internet to the rescue and I discovered some PyGame code to handle mouseHovers and mouseClicks, rect_clicky_change.py
This is what I have right now: pygame_rect_clickable.py
- Add the color selector bar that you find in paint to choose the color to highlight a block
- Add saving state to a format that the server can take.
- Add 'next frame' so you can create a movie like block art display.
<?xml version="1.0" encoding="UTF-8"?>
<blm width="18" height="8" bits="8" channels="3">
	<header>
		<creator>ULPaints</creator>
	</header>


	<frame duration="100">
		<row>000000000000000000000000000000000000000000000000000000000000000000000000000000000000000000000000000000000000</row>
		<row>000000000000000000000000000000000000000000000000000000FF0000000000000000000000000000FF0000FF0000000000000000</row>
		<row>000000000000000000000000FF0000FF0000000000000000000000FF0000000000000000000000000000FF0000FF0000000000000000</row>
		<row>000000000000000000000000FF0000FF0000000000000000000000FF0000000000000000000000000000000000000000000000000000</row>
		<row>000000000000000000000000FF0000FF0000FF0000FF0000FF0000FF0000000000000000000000000000FF0000FF0000000000000000</row>
		<row>000000000000000000000000FF0000FF0000000000000000000000FF0000000000000000000000000000FF0000FF0000000000000000</row>
		<row>000000000000000000000000FF0000FF0000000000000000000000FF0000000000000000000000000000FF0000FF0000000000000000</row>
		<row>000000000000000000000000000000000000000000000000000000000000000000000000000000000000000000000000000000000000</row>
	</frame>
</blm>
You can see the output of "H i" if you look at it from a distance.
- 000000 BLACK - no output
- FF0000 RED
