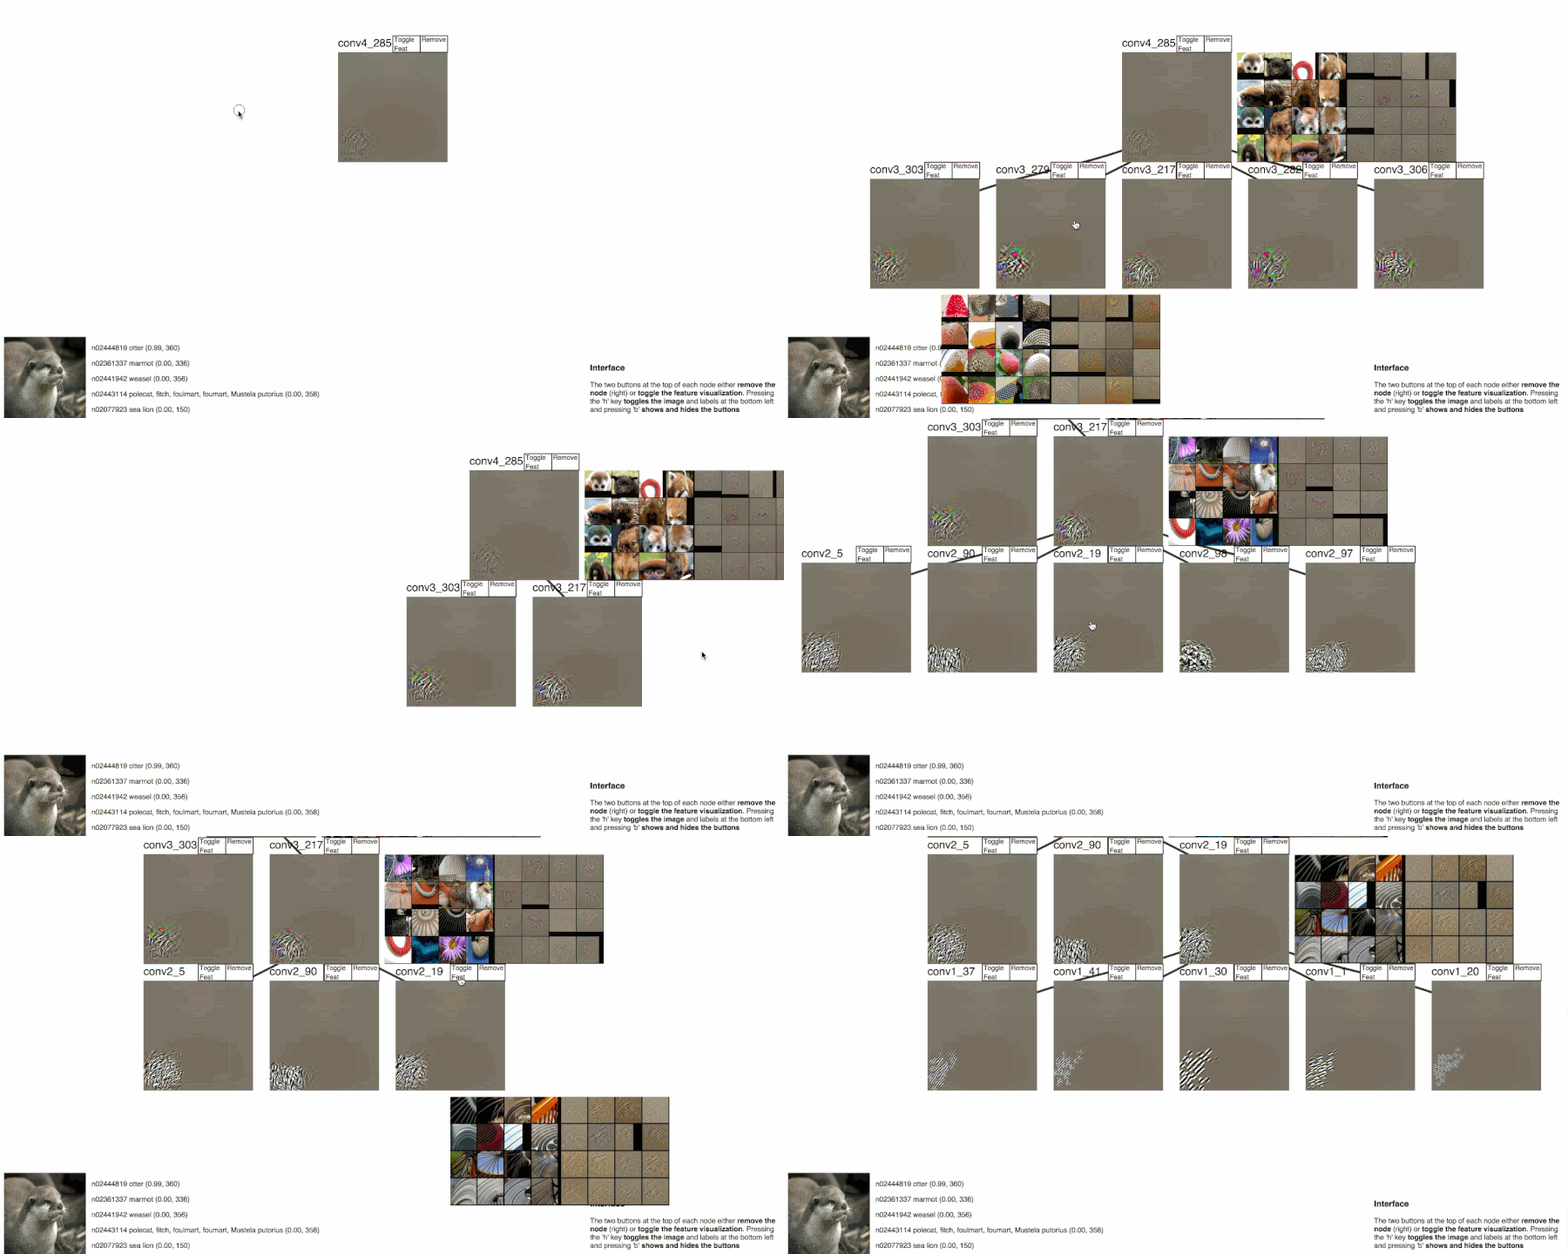
Convolutional Neural Networks (CNNs) understand images using a hierarchy of features, but it's hard to understand the hierarchy because the features are learned. Some techniques (e.g., proposed by Zeiler and Fersus) attempt to understand neurons in the CNN (nodes in the feature hierarchy) by roughly figuring out which parts of an image will most increase a neuron's activation. This gives some intuition about what a particular neuron likes to see, but it doesn't say much about how that neuron sees it. It doesn't show how nodes are related in the feature hierarchy.
This project tries to visualize parts of the feature hierarchy by showing how nodes are related in the context of one image. The demo below starts with a Zeiler/Fergus style visualization of a neuron that detects fur in conv4 then relates that neuron to others in conv3, conv2, and conv1. Hopefully this builds intuition about how features combine to form higher level representations.
Update: For more details, see my blog about this project here!
-
Setup directories and leave a pointer to the ImageNet val set (see
setup.sh).$ git clone --recursive git@github.com:mcogswell/cnn_treevis.git $ cd cnn_treevis/ $ ./setup.sh # set your own IMNET_VAL_LMDB -
Build caffe with python support (http://caffe.berkeleyvision.org/installation.html). Make sure the python module is importable from the cloned directory.
$ cd caffe/ $ make all py # do NOT use CuDNN! (see TODOs below) $ export PYTHONPATH=$PYTHONPATH:./caffe/python/ # allow importing caffe from the cloned directory -
Cache feature visualizations. This step can take a long time (a couple hours), but you can make it closer to an hour if you have multiple GPUs. To do so see the note at the top of the script.
$ ./scripts/cache_features_caffenet_imnet_val.sh -
To run the server:
$ python app.py caffenet_imnet_val --gpu-id <id> -
Try the visualization: go to http://localhost:5000/gallery in your browser and start exploring.
-
Open the gallery and click on an image. http://localhost:5000/gallery
-
Click an interesting neuron from that image. http://localhost:5000/vis/image_id/overview
-
Investigate the hierarchy beneath that neuron (e.g., demo). http://localhost:5000/vis/image_id?blob_name=&act_id=
One template is rendered for each of the 3 work flow steps listed above.
-
templates/gallery.htmlshows the list of available images fromdata/gallery/. -
templates/overview.htmlsubmits requests for Zeiler/Fergus style visualizations of the top neurons of each layer to the backend. -
templates/vis.htmluses d3js to draw the tree and submits requests for more Zeiler/Fergus style visualizations filtered by the explored feature hierarchy.
Visualization components are served from a Flask app (app.py).
This interacts with a dynamic component which generates example-specific
visualization components and a static/cached component which serves network-specific
images (not example-specific).
This renders each template listed in the frontend section and as well as the Zeiler/Fergus gradient images.
Each page/component is retrieved through a separate HTTP request.
See app.py for the API.
###Dynamic Vis Generator
All of the Zeiler/Fergus or Guided Backprop based images which are specific to the
example image are generated at runtime. Each vis page is associated with a VisTree
instance (lib/recon/reconstruct.py) which stores and computes vis components for one image.
###Cached Vis Generator
Some parts of the application are generated before runtime and cached
as static content. Currently, this only includes neuron-wise visualizations,
which must be generated offline with a command line utility (see scripts/cache_features_caffenet_imnet_val.sh).
See the FeatBuilder class in lib/recon/reconstruct.py for the implementation.
A couple types of "gradient" visualizations are available. See lib/recon/config.py
for examples of nets that use different types:
DECONV: Restrict ReLU gradient according to Zeiler and Fergus.GUIDED: Restrict ReLU gradient even more according to Striving for Simplicity.GUIDED_NEG: This is an experiment with which parts of the ReLU gradient work well. The method only passes gradients back through a ReLU when the top part is negative (see ReLU gradient implementation in the caffe submodule). The results are slightly sharper, but pretty much the same asGUIDED.
