
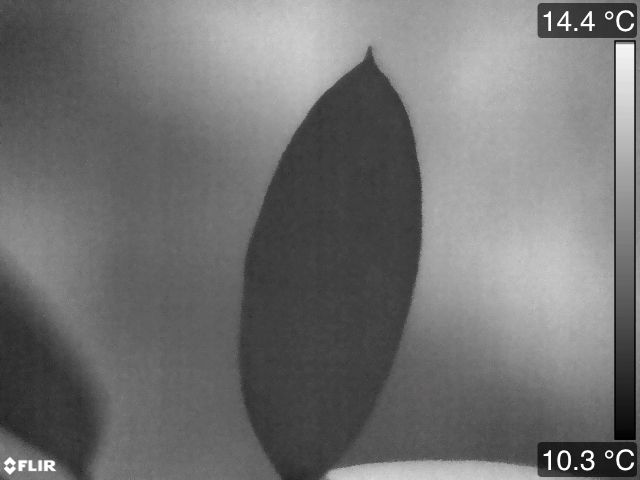
Allows for filtering of subject data at high resolutions from thermal image datasets. Useful for when you want to acquire thermal distribution and not just point measurements.
Python 3 (to run this)
I recommend using Anaconda to create a Python 3 environment.
Tested on Mac (10.10 and higher) and Linux (Ubuntu)
Recommended but not required:
- ImageJ for making image masks
- Export each photo from FLIR Tools in grayscale, and remove extra marks (e.g. point measurements).
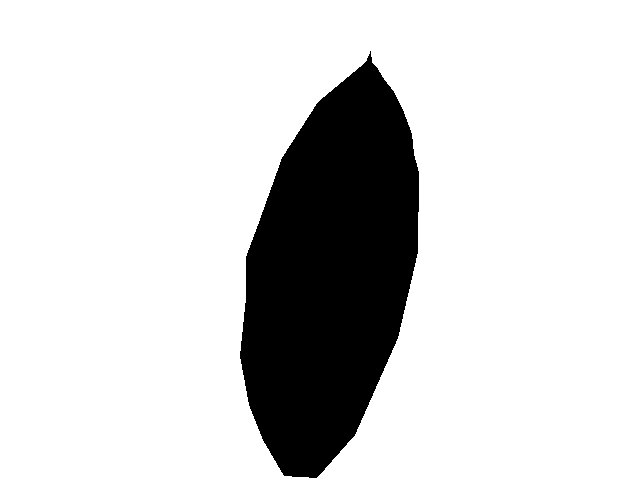
- Create mask image in ImageJ
- Select the area you want with the Polygon tool
- Fill
- Clear Outside
- Selection > Select None (or just click outside the polygon)
- Invert (The area of interest should be in black and the areas to ignore in white)
- (If your object has a clear background, you can also try using Threshold instead.)
- Save As ... > Jpeg
- Repeat for each image in dataset to be processed. (The pipeline and further statistics will likely take some time to process, so you might want to make a minimal working dataset to test your full analysis pipeline on)
- Encode sample name, image filename, min/max temperature, and mask filename in a table (see template)
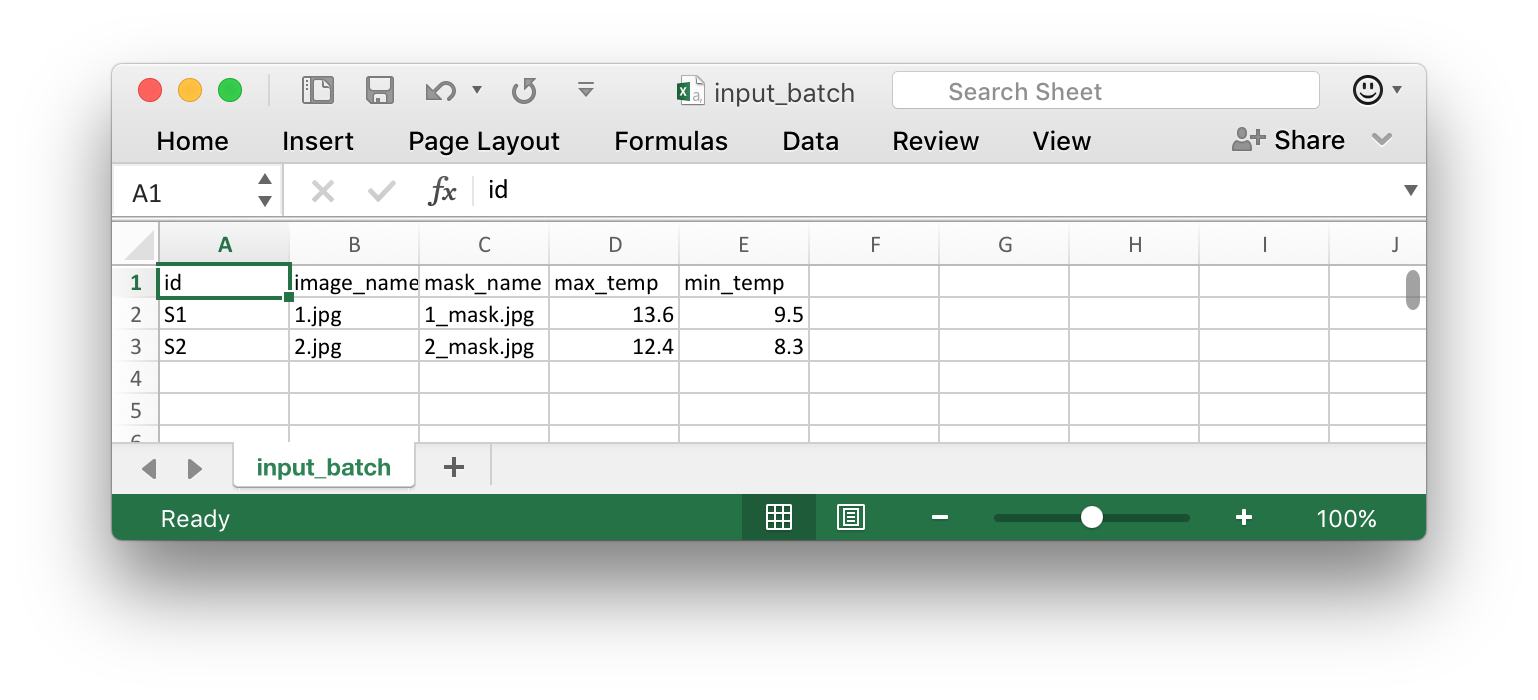
- Ensure that all the images and
input_batch.csvare in the same folder.


- Run batch.py on the Terminal with
python batch.py <folder path>. On Mac, you can insert the folder path by dragging the folder on to the Terminal window. - You should get some messages like this:
Initializing ...
Starting image 1............done!
Starting image 2............done!
Saving csv ...
Completed!
- Look in the folder for an
output.csv. This file can now be further processed by your statistical package.
