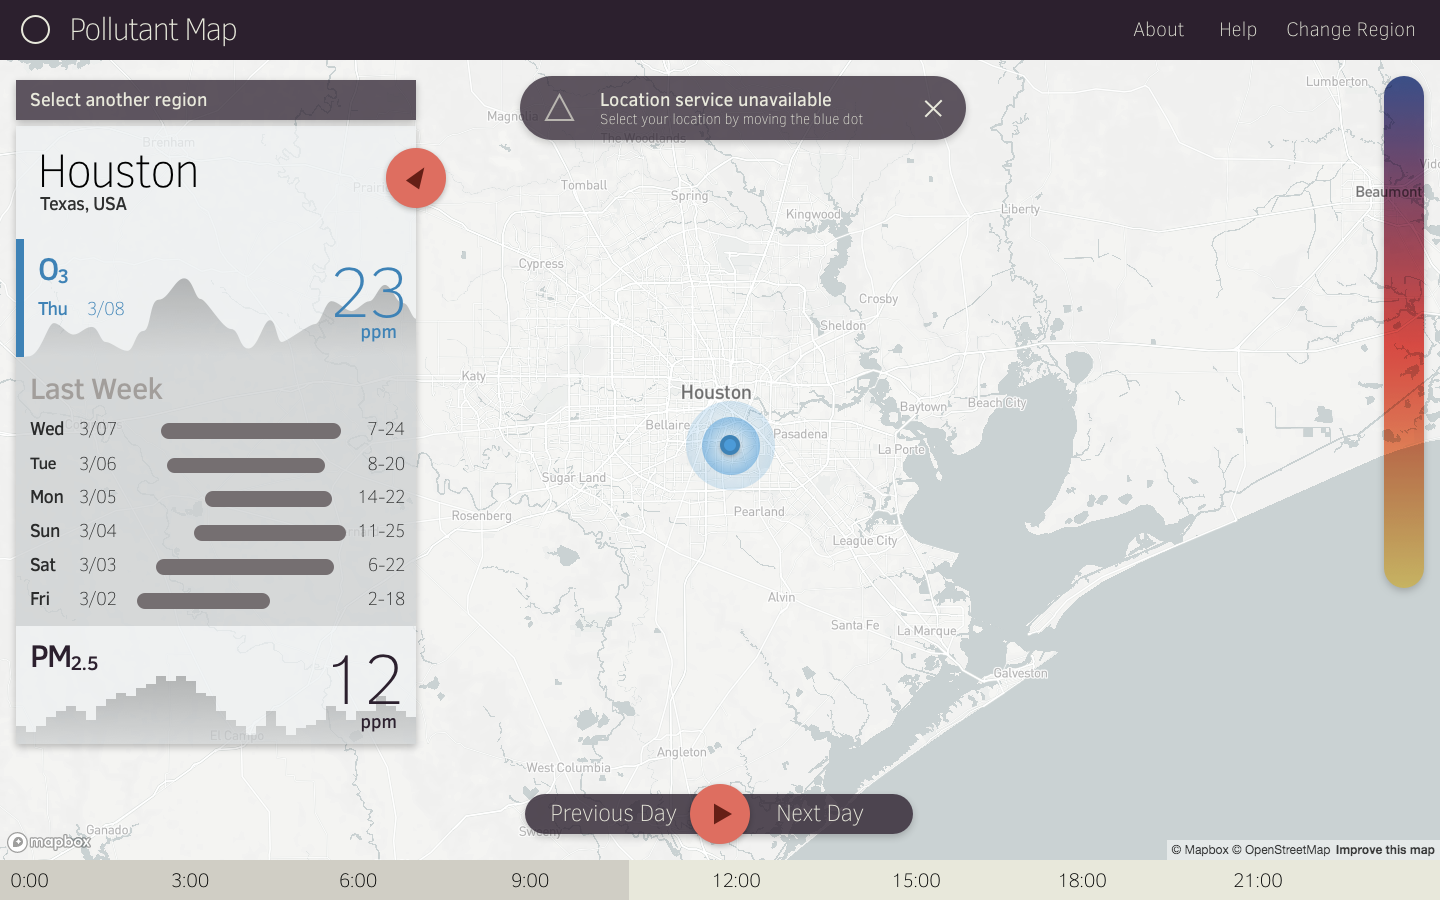
Pollutant Map
This project aims to make air quality and pollution data available to the public in an easy to access manner.
Project Structure
Development is happening in a few streams, which will eventually be merged:
- extras/colormap.html - implementation of WebGL color map and cubic data interpolation
- src/ - implementation of React + deck.gl
- Not in this repo - Meteor + MongoDB backend
Development
To build the React project, first run
npm install
then you can run the automated development server using
npm run start
To build for production deployment, run
npm run build
which will output files into a build/ directory. These can then be served with a static server:
npm install -g serve
serve -s build
or deployed to GitHub pages directly (in the gh-pages branch) which is automated by the command
npm run deploy
Requirements
This project depends on:
- React for frontend and user interface
- deck.gl for map-based visualization interface (based on top of luma.gl and Mapbox)
- Meteor
Implementation Details
The pollutant map is built on web technologies so that it can be rapidly and massively available to the public. We chose Meteor as the server to take advantage of its real-time updates.
Data is synchronized to the server via rsync directly from the TCEQ. The data is in a text format:
48_231_1006|20170601043000|42602|1|99|8|4.68705|VAL|N|1913.07|0.0333333|1
48_231_1006|20170601043000|42603|1|99|8|4.74423|VAL|N|1988.38|-0.0333333|1
48_231_1006|20170601043000|44201|1|87|8|32.7879|VAL|N|1962.11|2.66667|1
48_231_1006|20170601043000|61103|1|20|12|0.6|VAL|N|1|0|1
48_231_1006|20170601043000|61104|1|20|14|132.13|VAL|N|1|0|1
48_231_1006|20170601043000|62101|1|40|15|74.77|VAL|N|1|0|1
48_231_1006|20170601043000|63301|1|11|25|0|VAL|N|1|0|1
48_231_1006|20170601043500|42602|1|99|8|4.89614|VAL|N|1913.07|0.0333333|1
48_231_1006|20170601043500|42603|1|99|8|4.79452|VAL|N|1988.38|-0.0333333|1
48_231_1006|20170601043500|44201|1|87|8|29.2203|VAL|N|1962.11|2.66667|1
Each line represents one measurement from a single sensor at a single location at a single point in time. In order, the data in each line (segmented by |) is as follows:
- Site: EPA Site ID (
STATE_COUNTY_SITE) - Timestamp:
YYYYMMDDHHmmSS - Parameter: EPA Parameter Number (pollutant or measurement)
- POC: parameter occurence code - the ID of the parameter if more than one measurement is made per site
- Method: EPA Method Code (sensor)
- Units: EPA Units Code
- Value: measurement value
- Flag: TCEQ flags
- Verified: whether this measurement has been reviewed by a human (
Y|N) - Slope: conversion rate from sensor value to units value
- Intercept: conversion bias from sensor value to units value
- Samples: number of samples used in this measurement value
The server should watch for incoming files in /hnet/incoming/TCEQ/current. When a file arrives, this data should be parsed and imported directly into a MongoDB collection.
After import, the data is fed into the atmospheric interpolation model. This transforms the irregular 2D geographic data into a regular 2D grid, which is defined by a region. The specifics of this model is described in extras/interpolation.md.
The 2D grid data should be computed for a number of regions within Texas. The primary focus is on Houston. A region is defined by:
- the region ID
- the name of the region
- its rectangular coordinate boundaries
- the number of horizontal and vertical samples
- the list of sites that are used to compute this region's data
- the last time this data was modified
The 2D grid data for a single region at a single point of time is defined by:
- region ID
- timestamp
- paramater (pollutant or measurement)
- [UNDECIDED] the list of sites that were used to compute this data
- the data itself (2D array)
The regions and 2D grid data are synchronized in real-time (via Meteor) to the front-end, where the data is displayed in a custom deck.gl layer over MapboxGL. The UI should allow for a heatmap or contour-based visualization with variable levels of discretization and color mapping. This is achieved through a bicubic interpolation of the grid data and subsequent color lookup from the color map. Additionally, the UI should allow for animation through time (linear interpolation), so several grid data sets must be loaded in at once. The user should be able to select different pollutants or measurements to display, and be able to select a date/time to view.