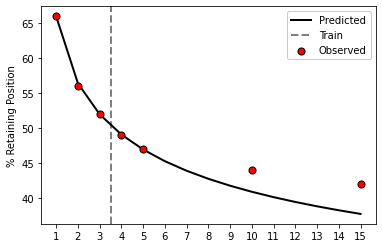
This is a python port of the R package foretell. This projects customer retention rates, see “How to Project Customer Retention” Revisited: The Role of Duration Dependence (Fader et al., 2018) for the original formulation and description of the models.
To install, just use pip:
pip install retenmod
Only dependencies are scipy and numpy. For a simple example of use for the BdW model:
import retenmod
surv = [100, 86.9, 74.3, 65.3, 59.3]
res = retenmod.bdw(surv,6)

print('Parameter Estimates')
print(res.params)

print('\nProjections')
print(res.proj)

# Showing the full object
res
Parameter Estimates
[0.25936277 1.7227105 1.5842661 ]
Projections
[100. 86.91457201 74.19302745 65.47868459 59.29349012
54.66117454 51.03695705 48.10442197 45.6687666 43.60356138
41.82301709]
churnmod(proj=array([100. , 86.91457201, 74.19302745, 65.47868459,
59.29349012, 54.66117454, 51.03695705, 48.10442197,
45.6687666 , 43.60356138, 41.82301709]), negLL=122.27493182897308, params=array([0.25936277, 1.7227105 , 1.5842661 ]))
Here is an example taken from Koper et al. (2002) on police staff retentions.
import matplotlib.pyplot as plt

large = [100,66,56,52,49,47,44,42]
time = [0,1,2,3,4,5,10,15]

# Only fitting with the first 3 values
train, ext = 4, 15
lrg_bdw = retenmod.bdw(large[0:train],ext - train + 1)

# Showing predicted vs observed
pt = list(range(16))
fig, ax = plt.subplots()
ax.plot(pt[1:], lrg_bdw.proj[1:],label='Predicted',
        c='k', linewidth=2, zorder=-1)
ax.scatter(time[1:],large[1:],label='Observed',
           edgecolor='k', c='r', s=50, zorder=1)
ax.axvline(train - 0.5, label='Train', color='grey',
           linestyle='dashed', linewidth=2, zorder=-2)
ax.set_ylabel('% Retaining Position')
ax.legend(facecolor='white', framealpha=1)
plt.xticks(pt[1:])
plt.show()
