The second part of the project involves visualizing communication trends data in Power BI. The process includes loading and transforming data in SSIS, followed by connecting the transformed data to Power BI. Step-by-step, the data is visualized into comprehensive reports, providing insights into communication trends.
Check out the demo video of the project here
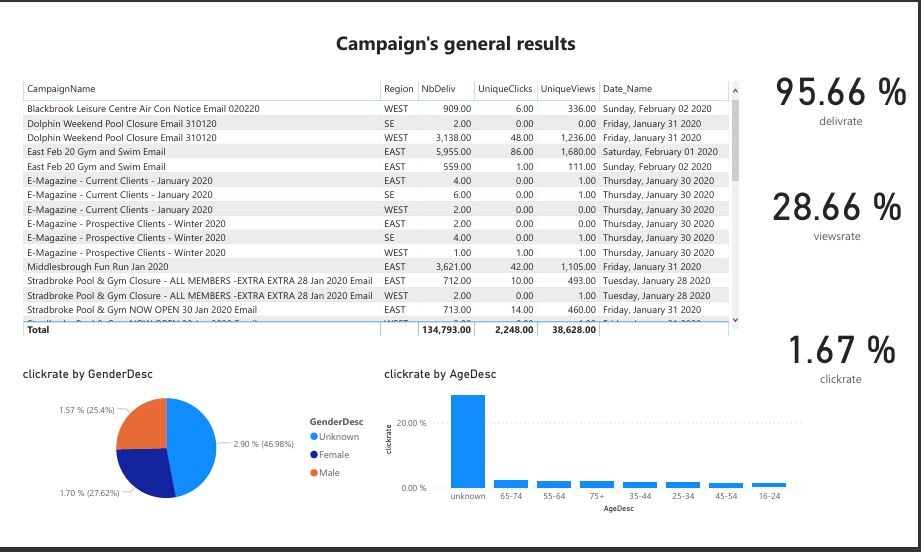
- 🧩 1. Step-by-Step Report Creation in Power BI: Guide through the process of creating detailed reports and charts in Power BI, visualizing communication trends data.
- Power Boi
- Data Visualisation
Contributions are what make the open source community such an amazing place to learn, inspire, and create. Any contributions you make are greatly appreciated.
- Fork the Project
- Create your Feature Branch (
git checkout -b feature/AmazingFeature) - Commit your Changes (
git commit -m 'Add some AmazingFeature') - Push to the Branch (
git push origin feature/AmazingFeature) - Open a Pull Request
Distributed under the MIT License. See LICENSE for more information.
Mohamed Nour KHammeri - @My-Web-Site - mednour.khl@gmail.com
Project Link: https://github.com/mednour2019/powerbi-comms-trend