Note: PMM2 is out!
Please see https://github.com/percona/grafana-dashboards/tree/PMM-2.0 for this repository details
This is a set of Grafana dashboards for database and system monitoring using Prometheus datasource.
- Advanced Data Exploration
- Amazon RDS / Aurora MySQL metrics (CloudWatch datasource)
- Compare System Parameters
- CPU Utilization Details (Cores)
- Cross Server Graphs
- Disk Performance
- Disk Space
- Home Dashboard
- MongoDB Cluster Summary
- MongoDB InMemory
- MongoDB MMAPv1
- MongoDB Overview
- MongoDB ReplSet
- MongoDB RocksDB
- MongoDB WiredTiger
- MySQL Amazon Aurora Metrics
- MySQL Command Handler Counters Compare
- MySQL InnoDB Metrics
- MySQL InnoDB Metrics Advanced
- MySQL InnoDB Compression
- MySQL MyISAM/Aria Metrics
- MySQL MyRocks Metrics
- MySQL Overview
- MySQL Performance Schema
- MySQL Performance Schema Wait Event Analyses
- MySQL Query Response Time
- MySQL Replication
- MySQL Table Statistics
- MySQL TokuDB Metrics
- MySQL User Statistics
- Network Overview
- NUMA Overview
- PostgreSQL Overview
- ProxySQL Overview
- Prometheus
- Prometheus Exporter Status
- Prometheus Exporters Overview
- PXC/Galera Cluster Overview
- PXC/Galera Graphs
- Summary Dashboard
- System Overview
- Trends Dashboard
- _PMM Add Instance
- _PMM Amazon RDS and Remote Instances
- _PMM Query Analytics Settings
- _PMM System Summary
These dashboards are also a part of Percona Monitoring and Management project.
Live demo is available at https://pmmdemo.percona.com/graph/
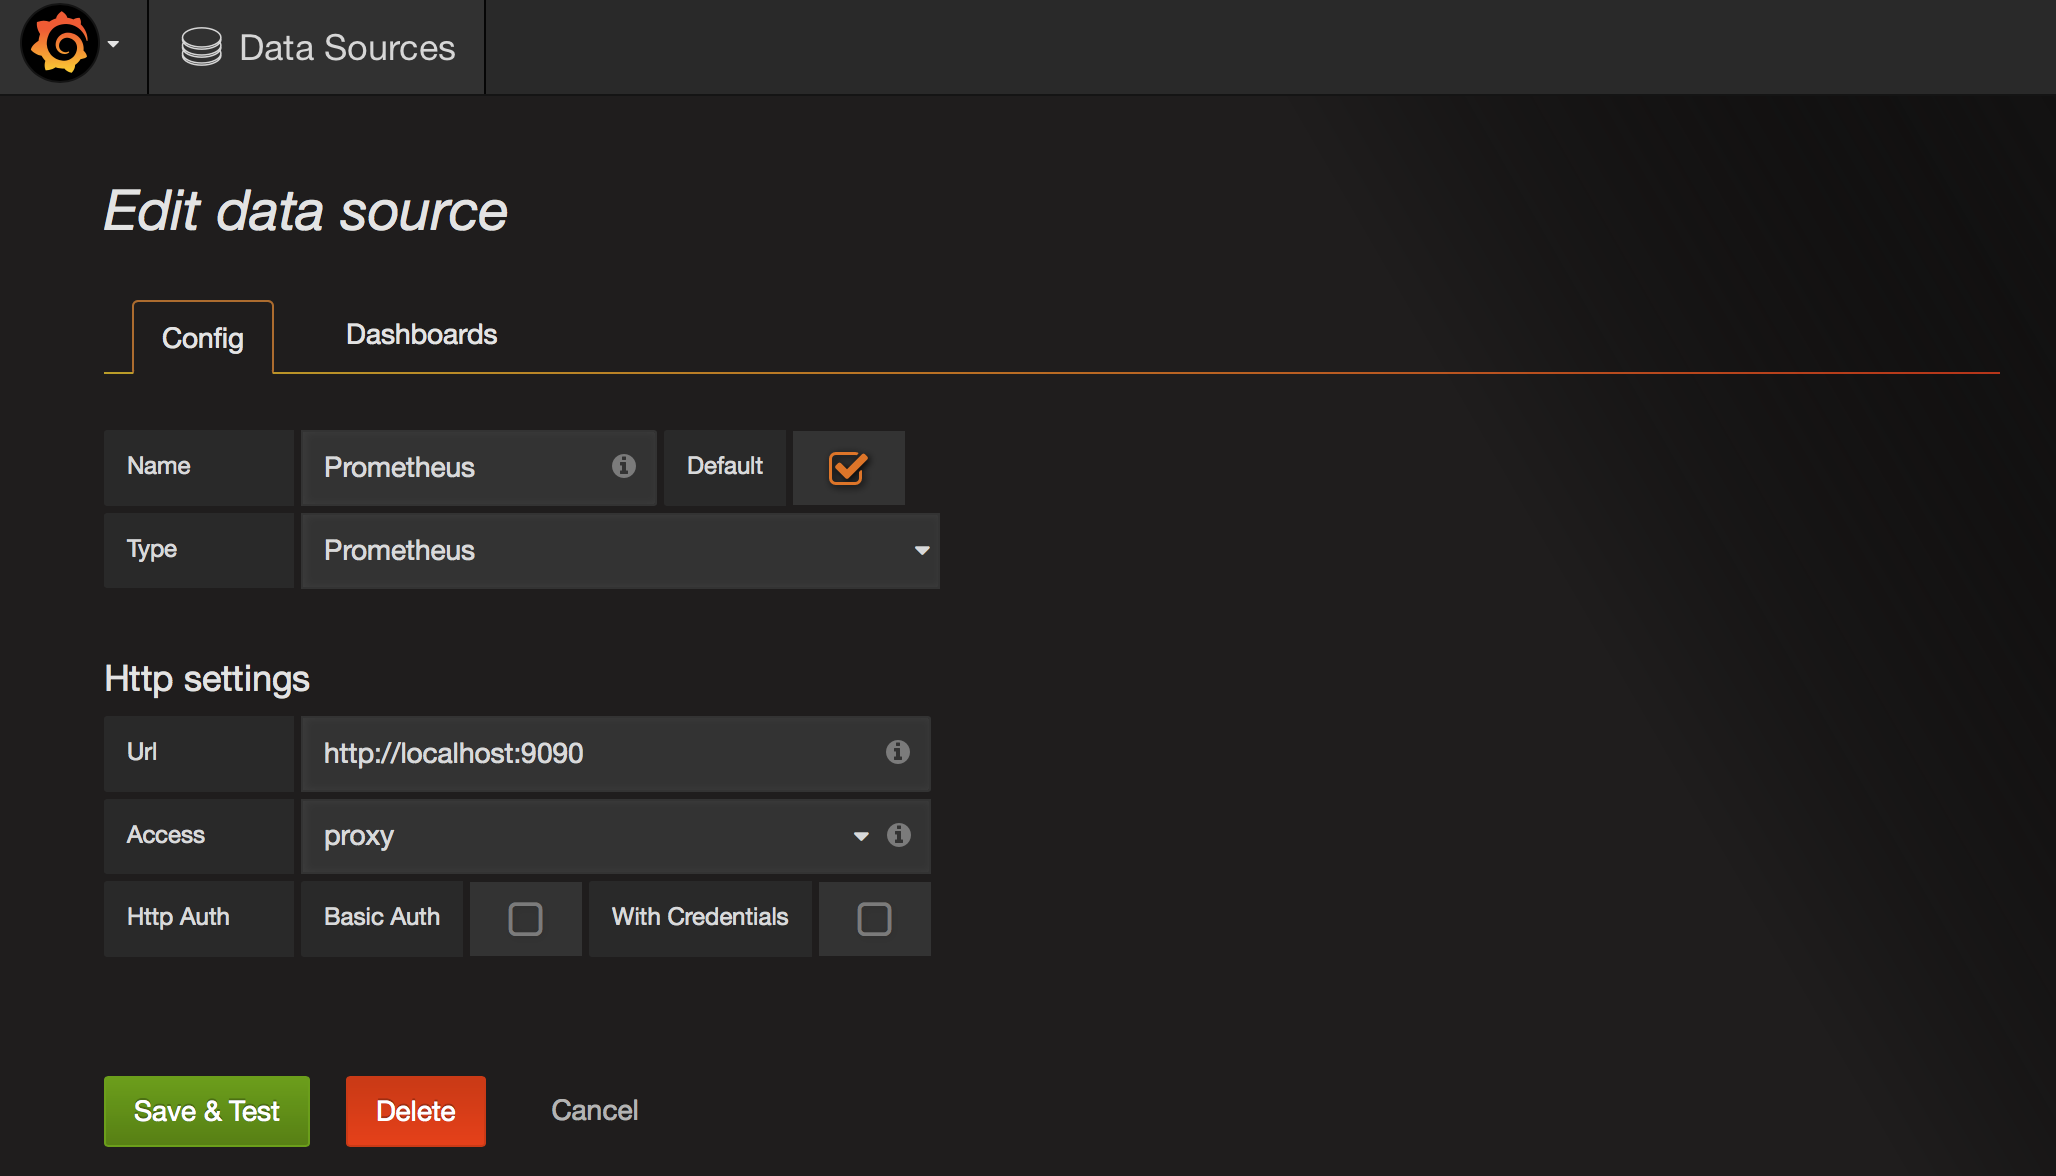
The datasource should be named Prometheus so it is automatically picked up by the graphs.
The dashboards use built-in instance label to filter on individual hosts.
It is recommended you give the good names to your instances. Here is some example:
scrape_configs:
  - job_name: prometheus
    static_configs:
      - targets: ['localhost:9090']
        labels:
          instance: prometheus

  - job_name: linux
    static_configs:
      - targets: ['192.168.1.7:9100']
        labels:
          instance: db1

  - job_name: mysql
    static_configs:
      - targets: ['192.168.1.7:9104']
        labels:
          instance: db1
How you name jobs is not important. However, "Prometheus" dashboard assumes the job name is prometheus.
Here is the minimal set of options for the exporters:
- node_exporter:
-collectors.enabled="diskstats,filefd,filesystem,loadavg,meminfo,netdev,stat,time,uname,vmstat" - mysqld_exporter:
-collect.binlog_size=true -collect.info_schema.processlist=true - mongodb_exporter: the defaults are fine.
Enable JSON dashboards by uncommenting those lines in grafana.ini:
[dashboards.json]
enabled = true
path = /var/lib/grafana/dashboards
If you wish you may import the individual dashboards via UI and ignore this and the next two steps.
First, download the code via git: git clone https://github.com/percona/grafana-dashboards.git
If you are using Grafana 4.x or below, do the following steps: cp -r grafana-dashboards/dashboards /var/lib/grafana/
If you are using Grafana 5.x or above, create mysqld_export.yml as the following content under /var/lib/grafana/conf/provisioning/dashboards
apiVersion: 1

providers:
  - name: 'mysqld_exporter'
     orgId: 1
     folder: ''
     type: file
     options:
       path: <you git repro path>/grafana-dashboards/dashboards
service grafana-server restart
If you are using Grafana 3.x you need to apply a small patch on your installation to allow the interval template variable in Step field of graph editor page
to get the good zoomable graphs. For more information, take a look at PR#5839.
sed -i 's/expr=\(.\)\.replace(\(.\)\.expr,\(.\)\.scopedVars\(.*\)var \(.\)=\(.\)\.interval/expr=\1.replace(\2.expr,\3.scopedVars\4var \5=\1.replace(\6.interval, \3.scopedVars)/' /usr/share/grafana/public/app/plugins/datasource/prometheus/datasource.js
sed -i 's/,range_input/.replace(\/"{\/g,"\\"").replace(\/}"\/g,"\\""),range_input/; s/step_input:""/step_input:this.target.step/' /usr/share/grafana/public/app/plugins/datasource/prometheus/query_ctrl.js
Simply copy the new dashboards to /var/lib/grafana/dashboards and restart Grafana or re-import them.
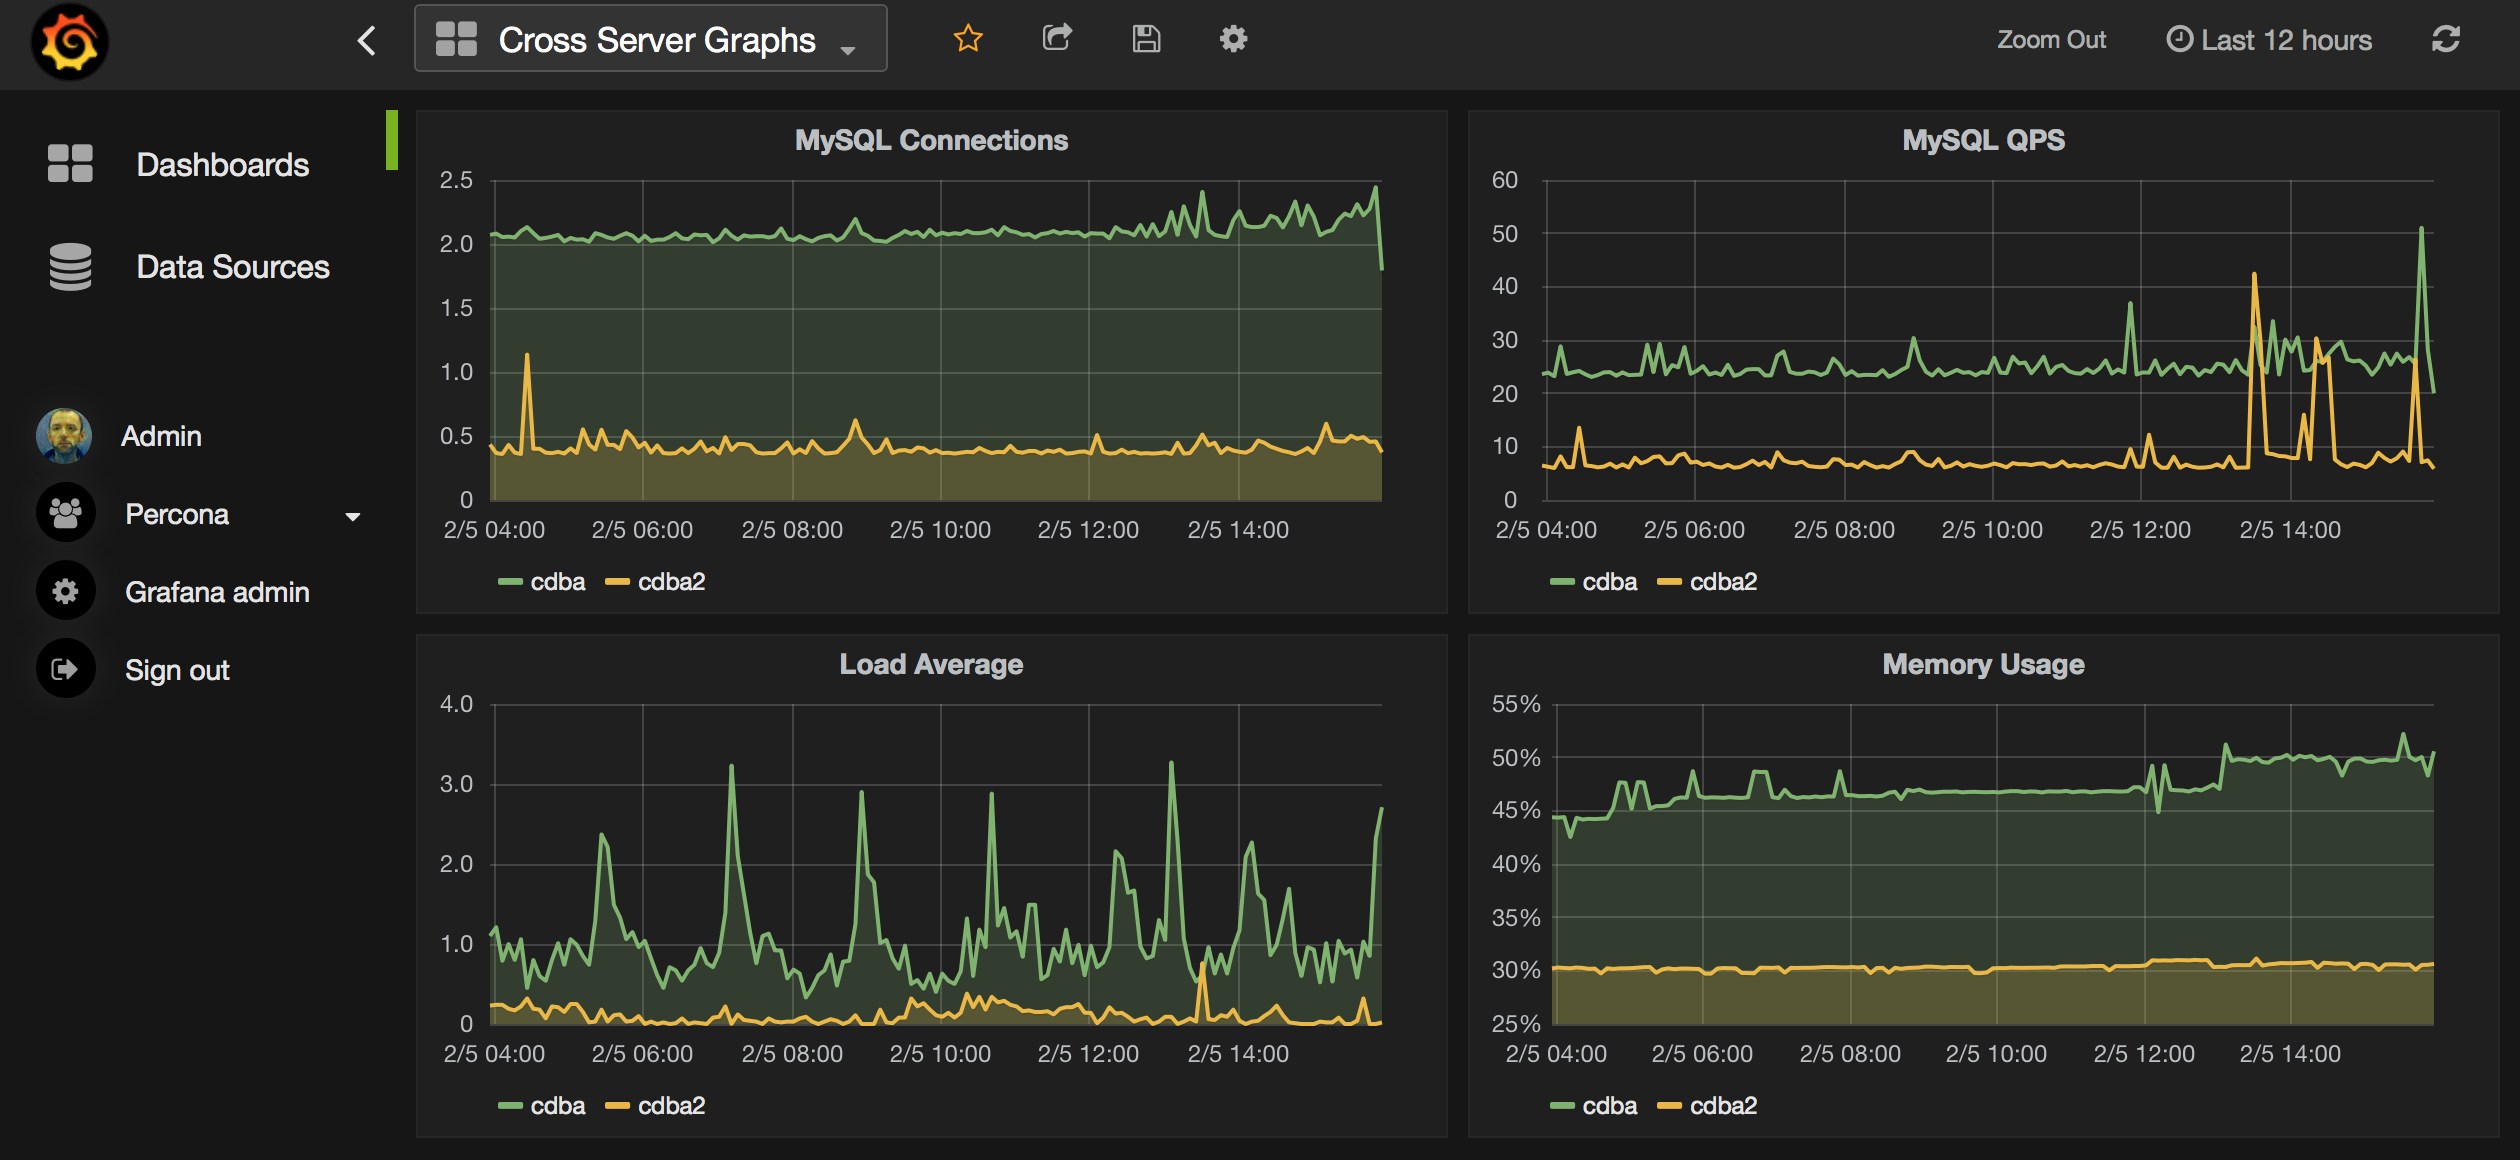
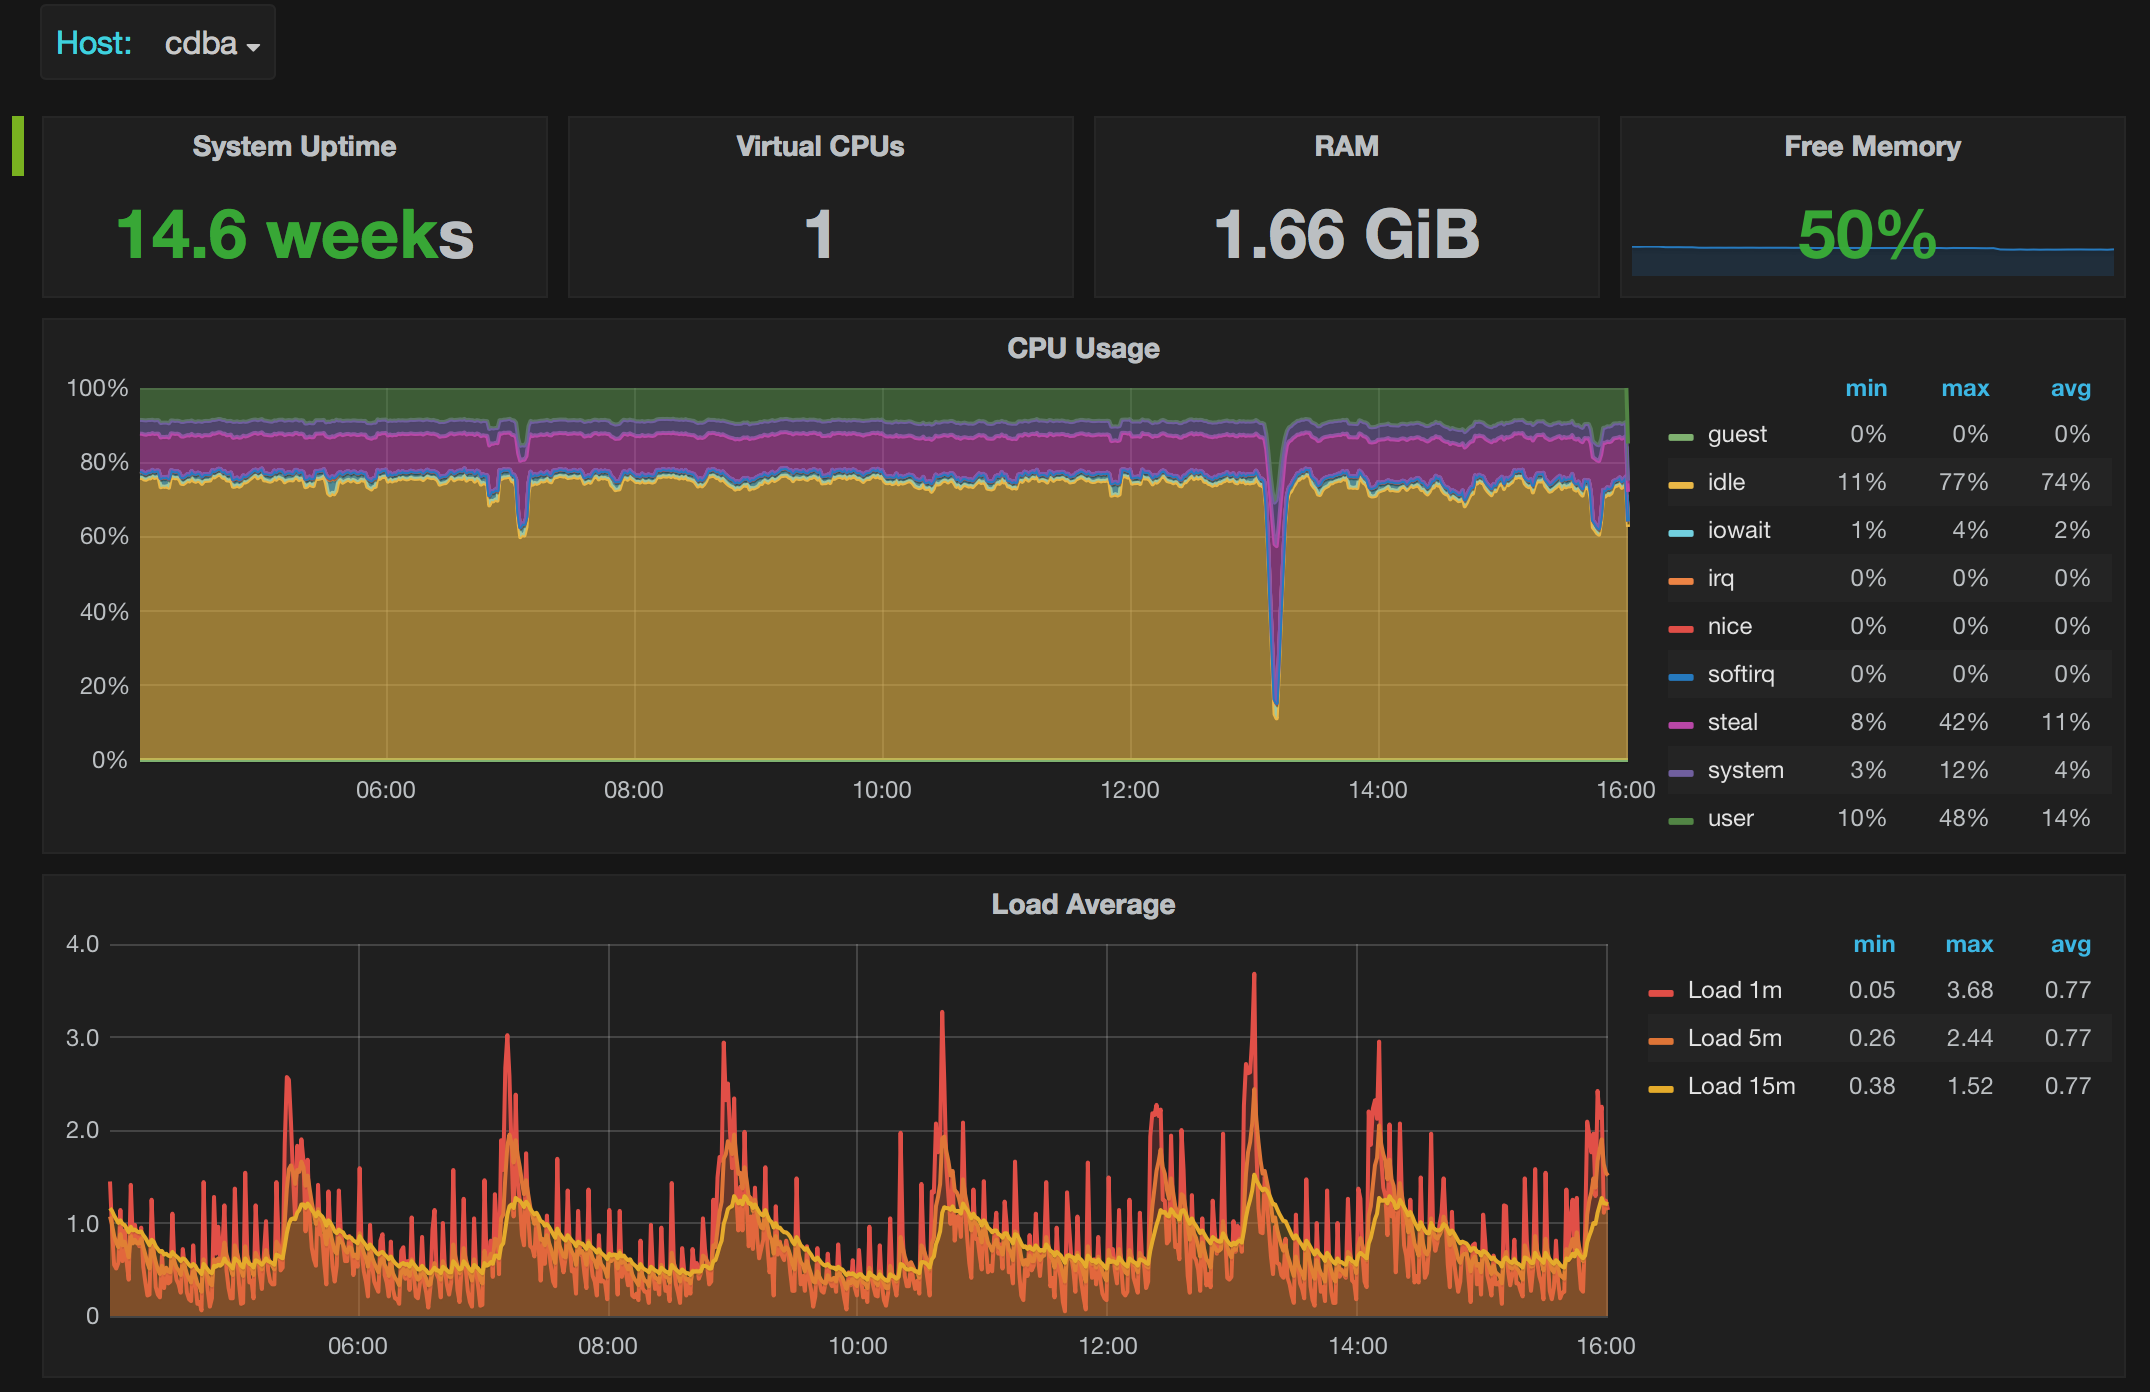
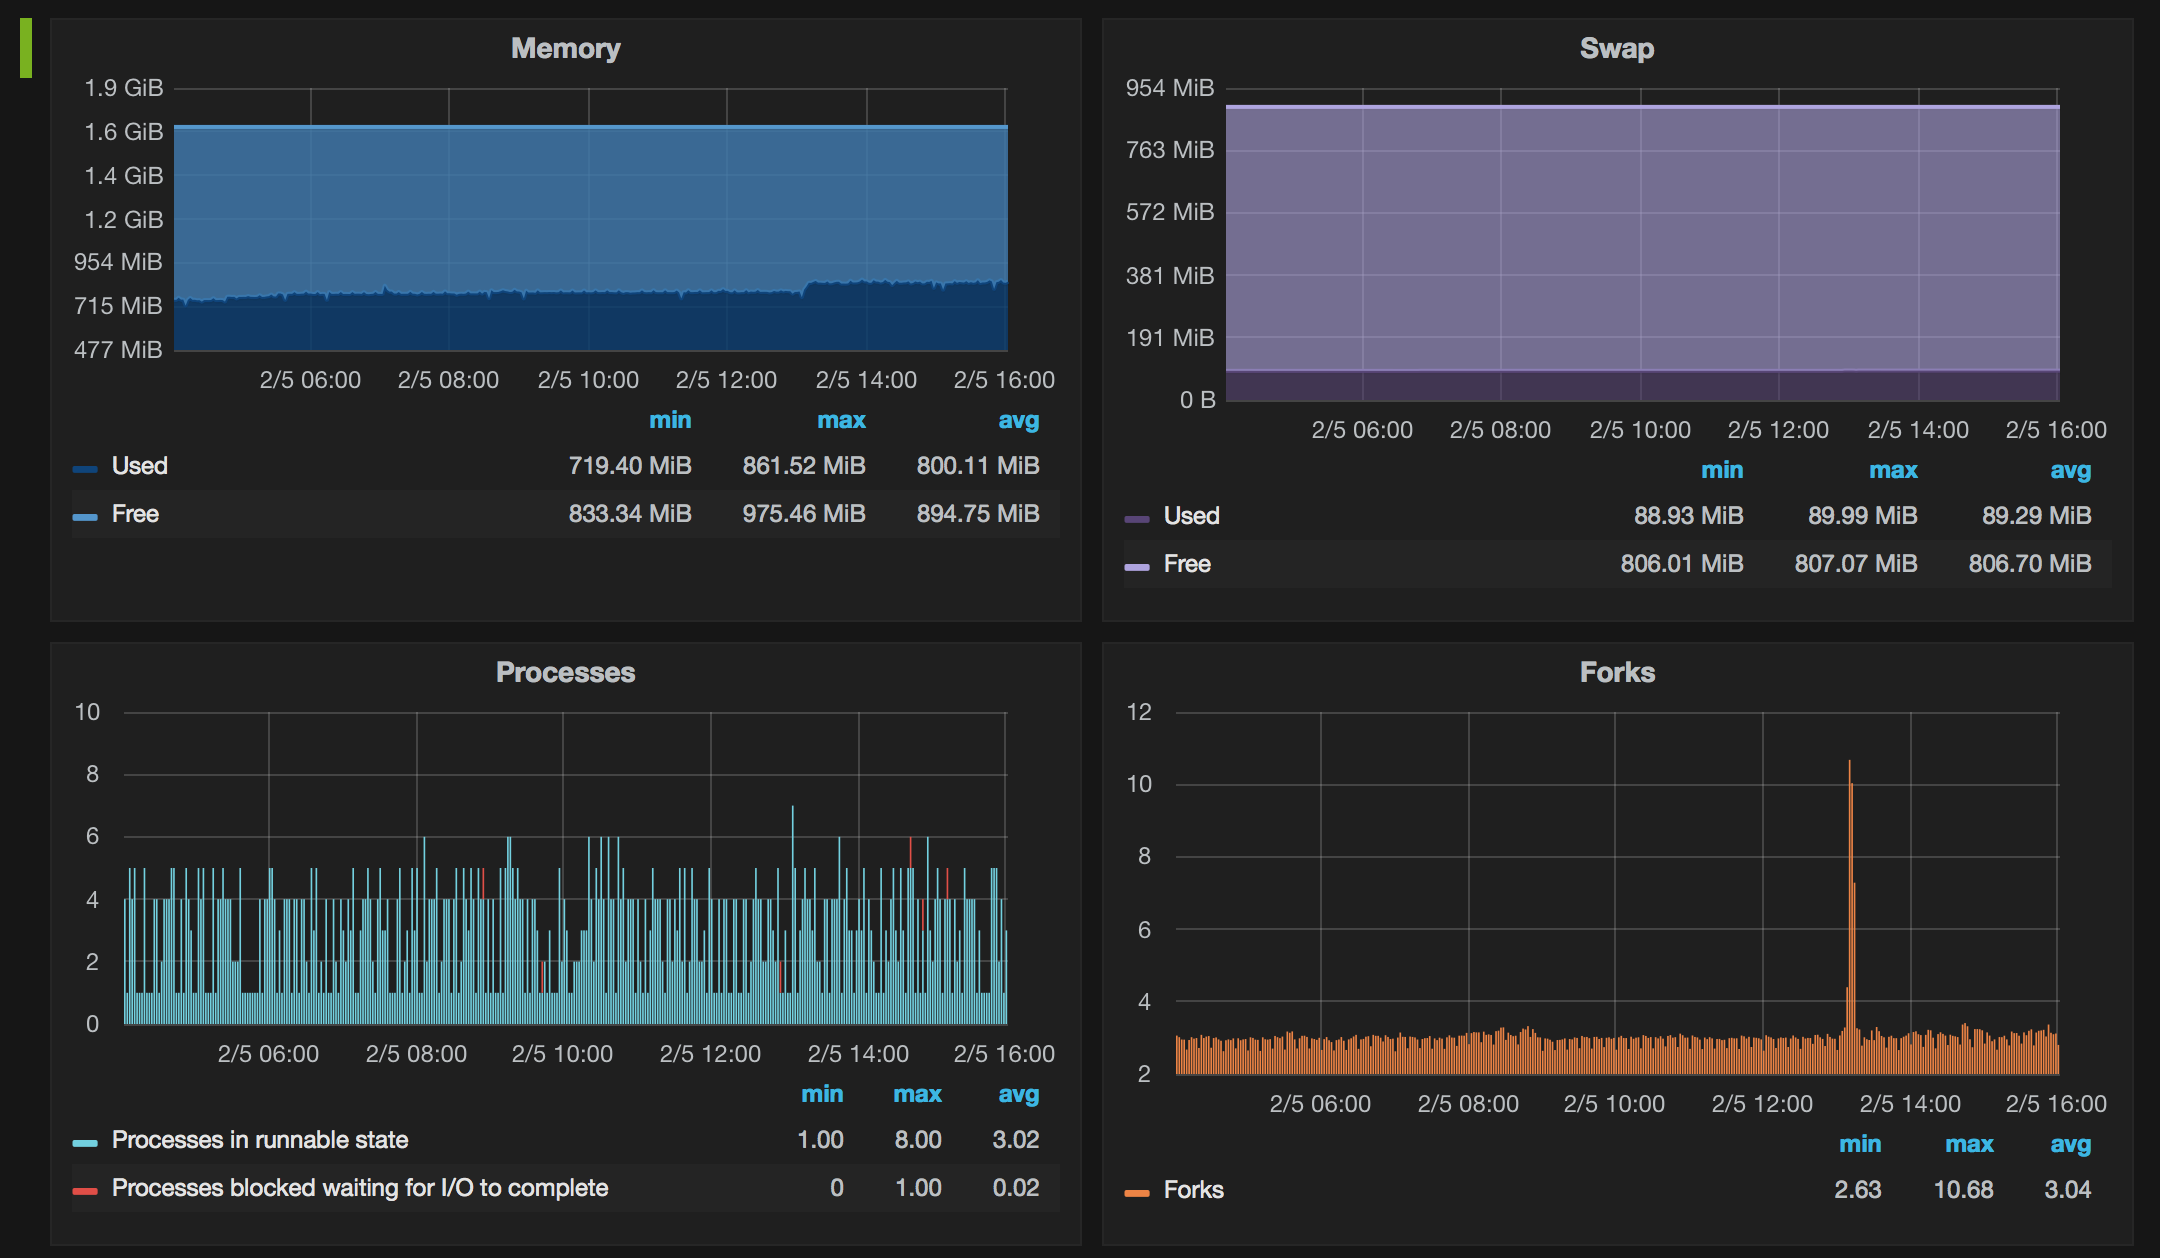
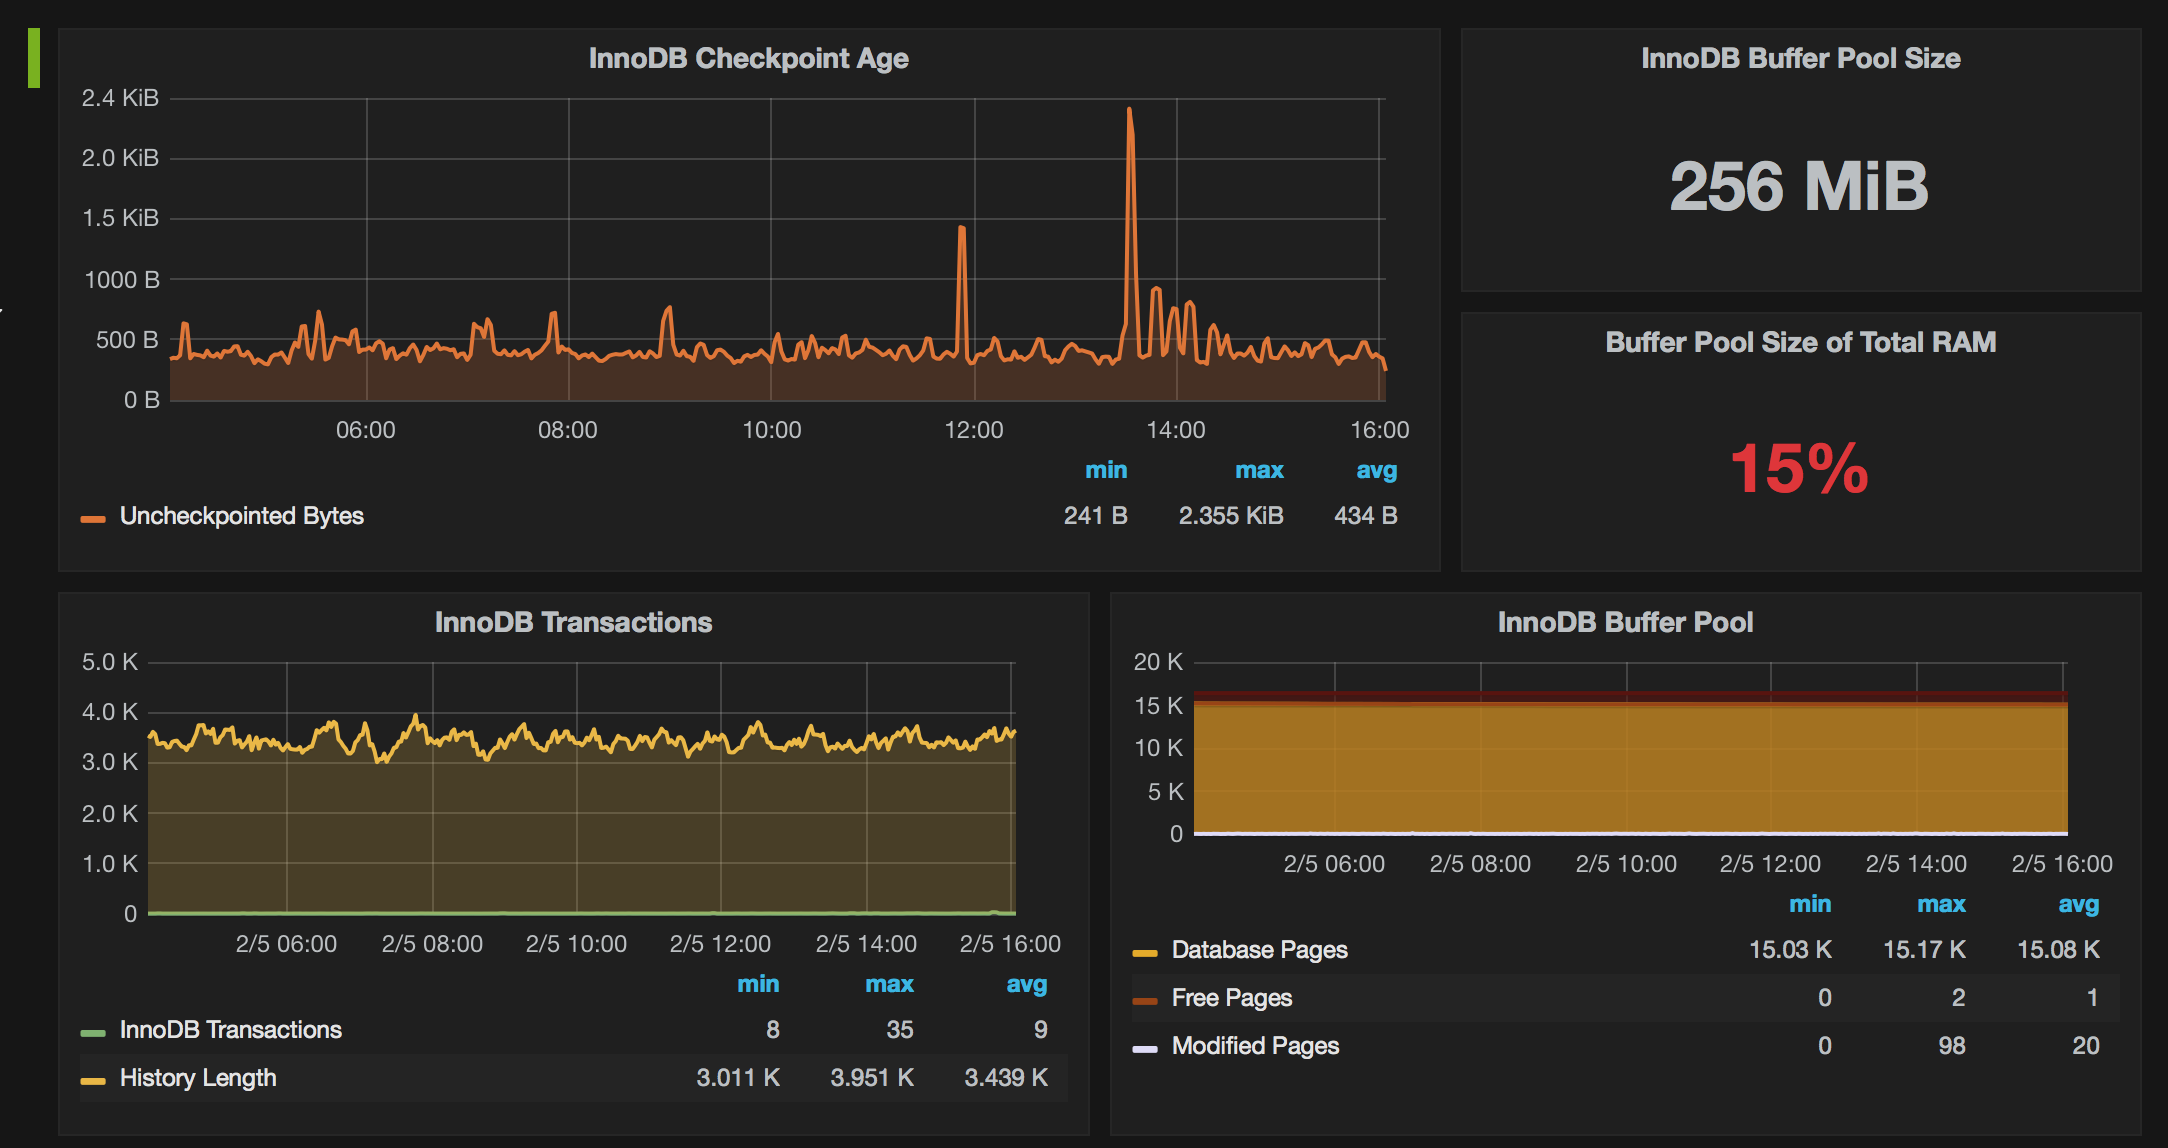
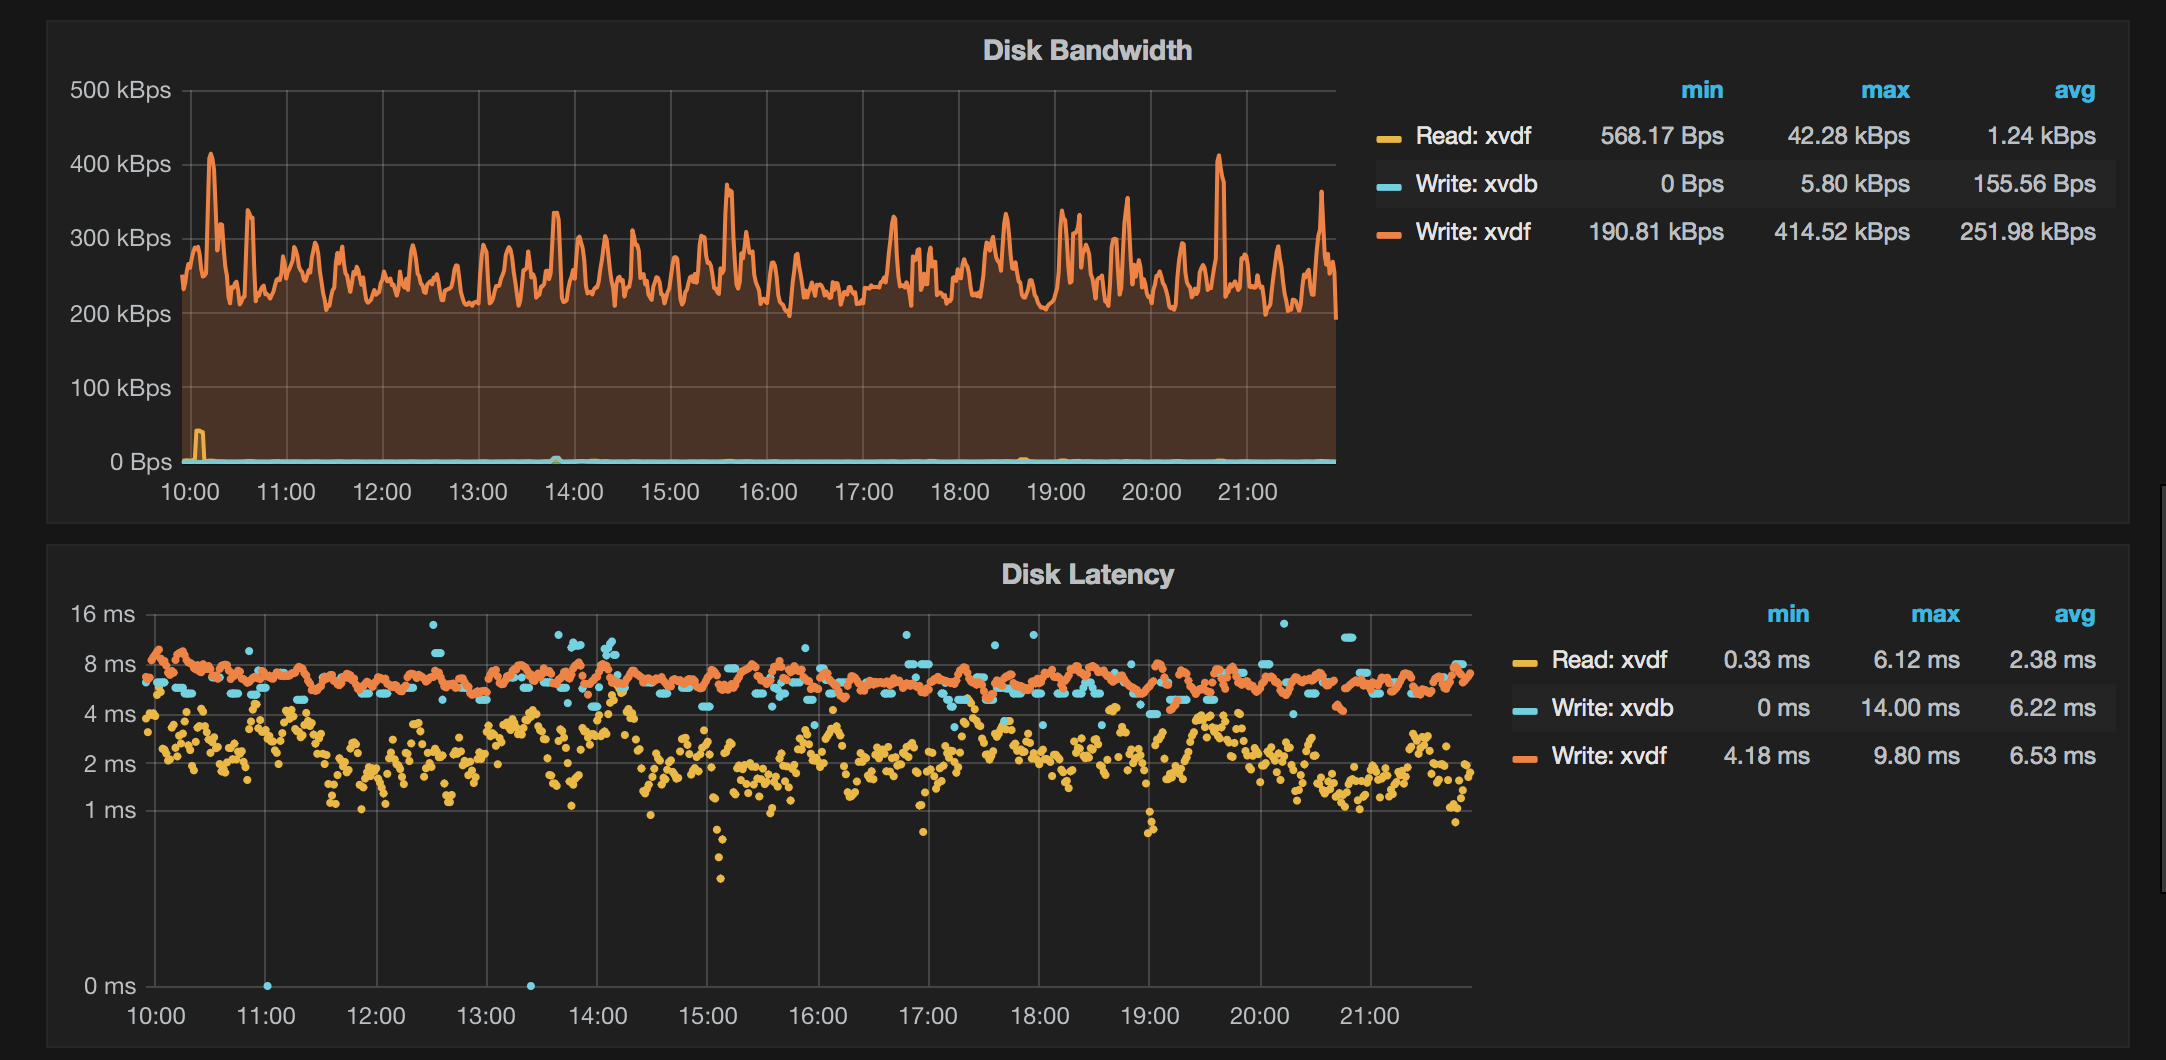
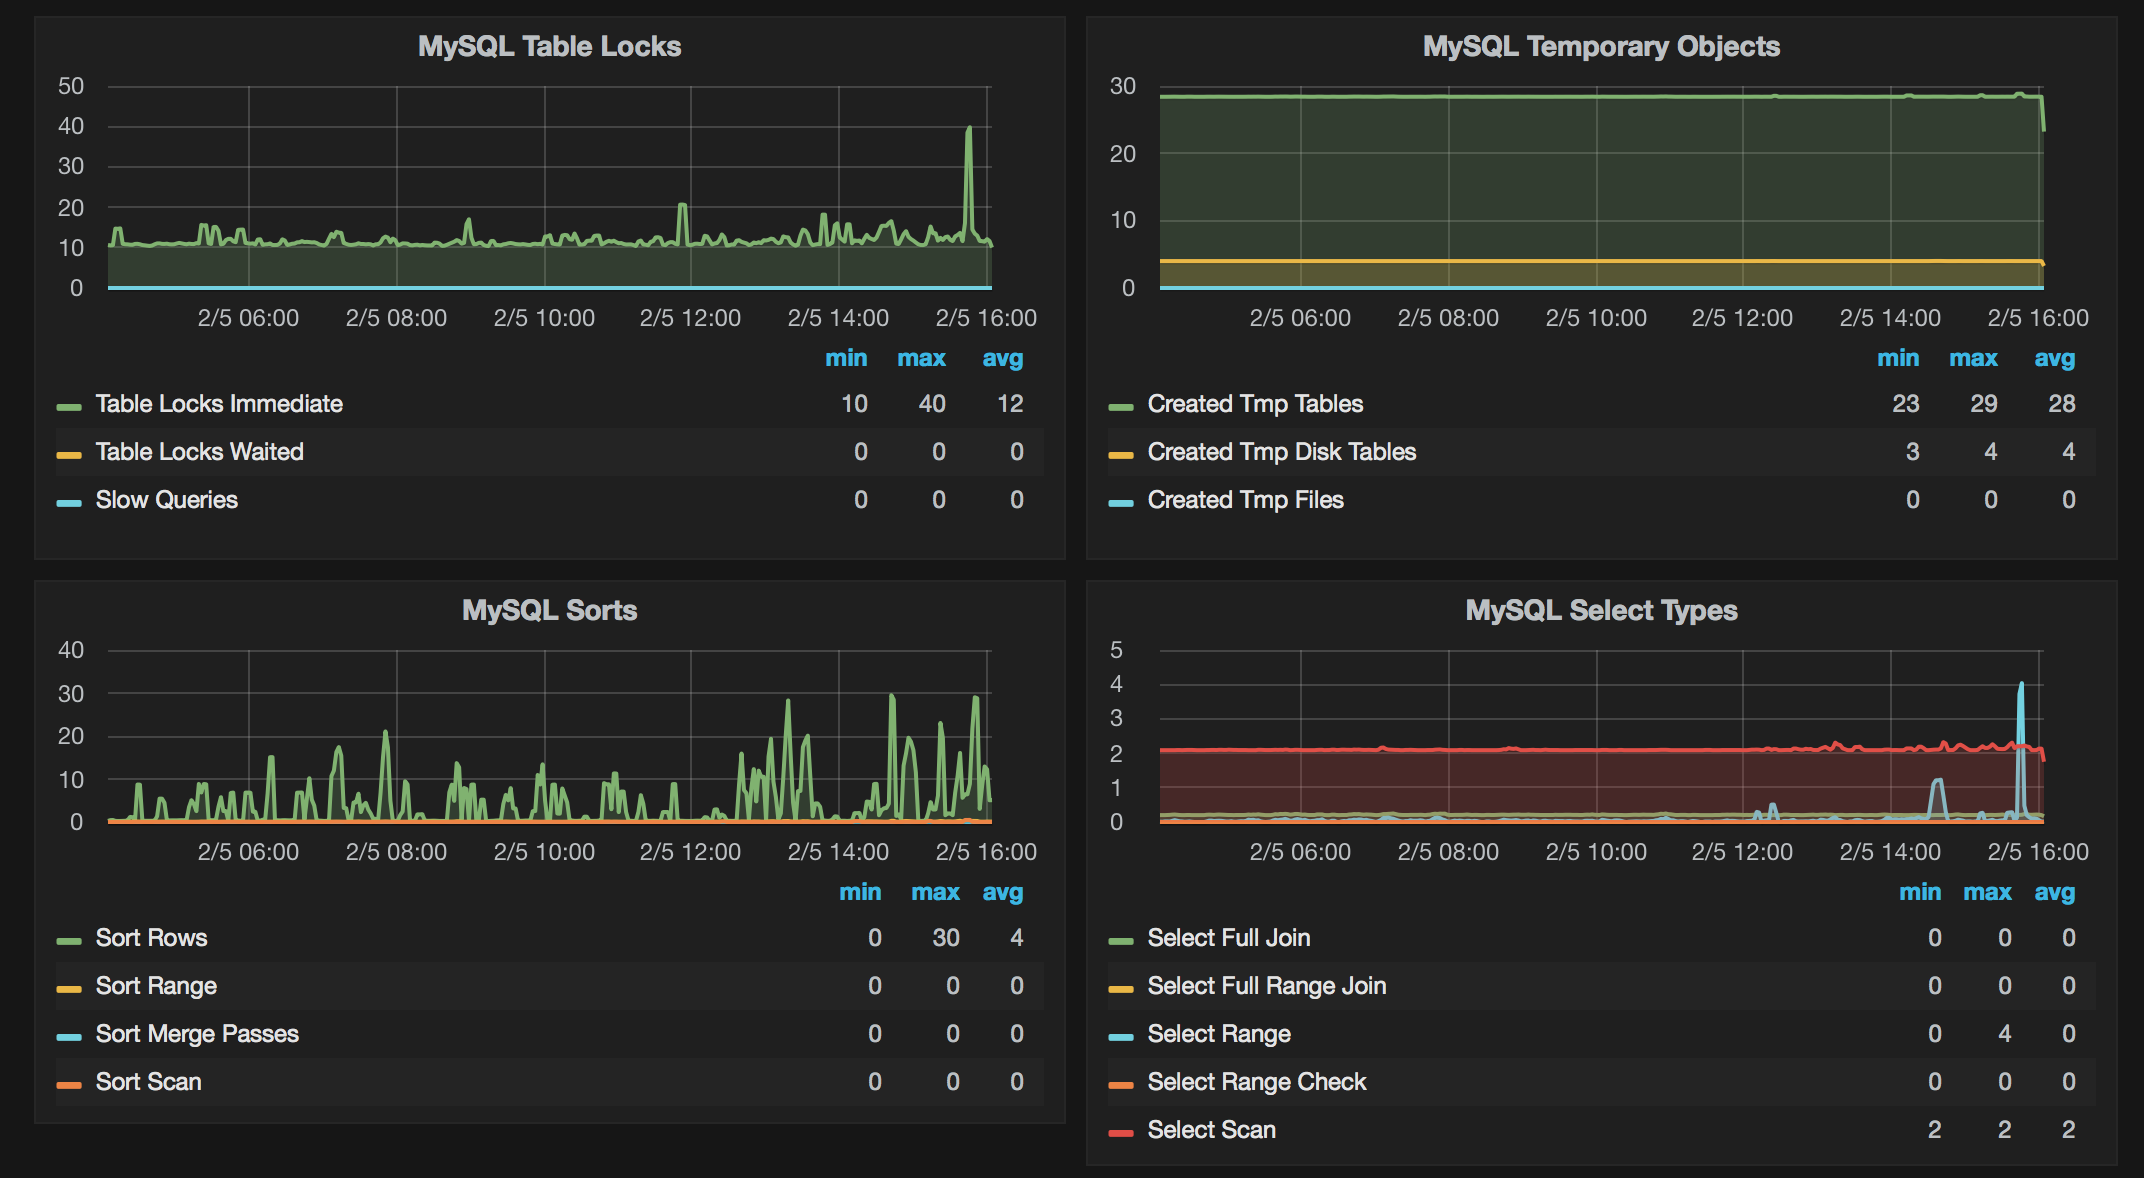
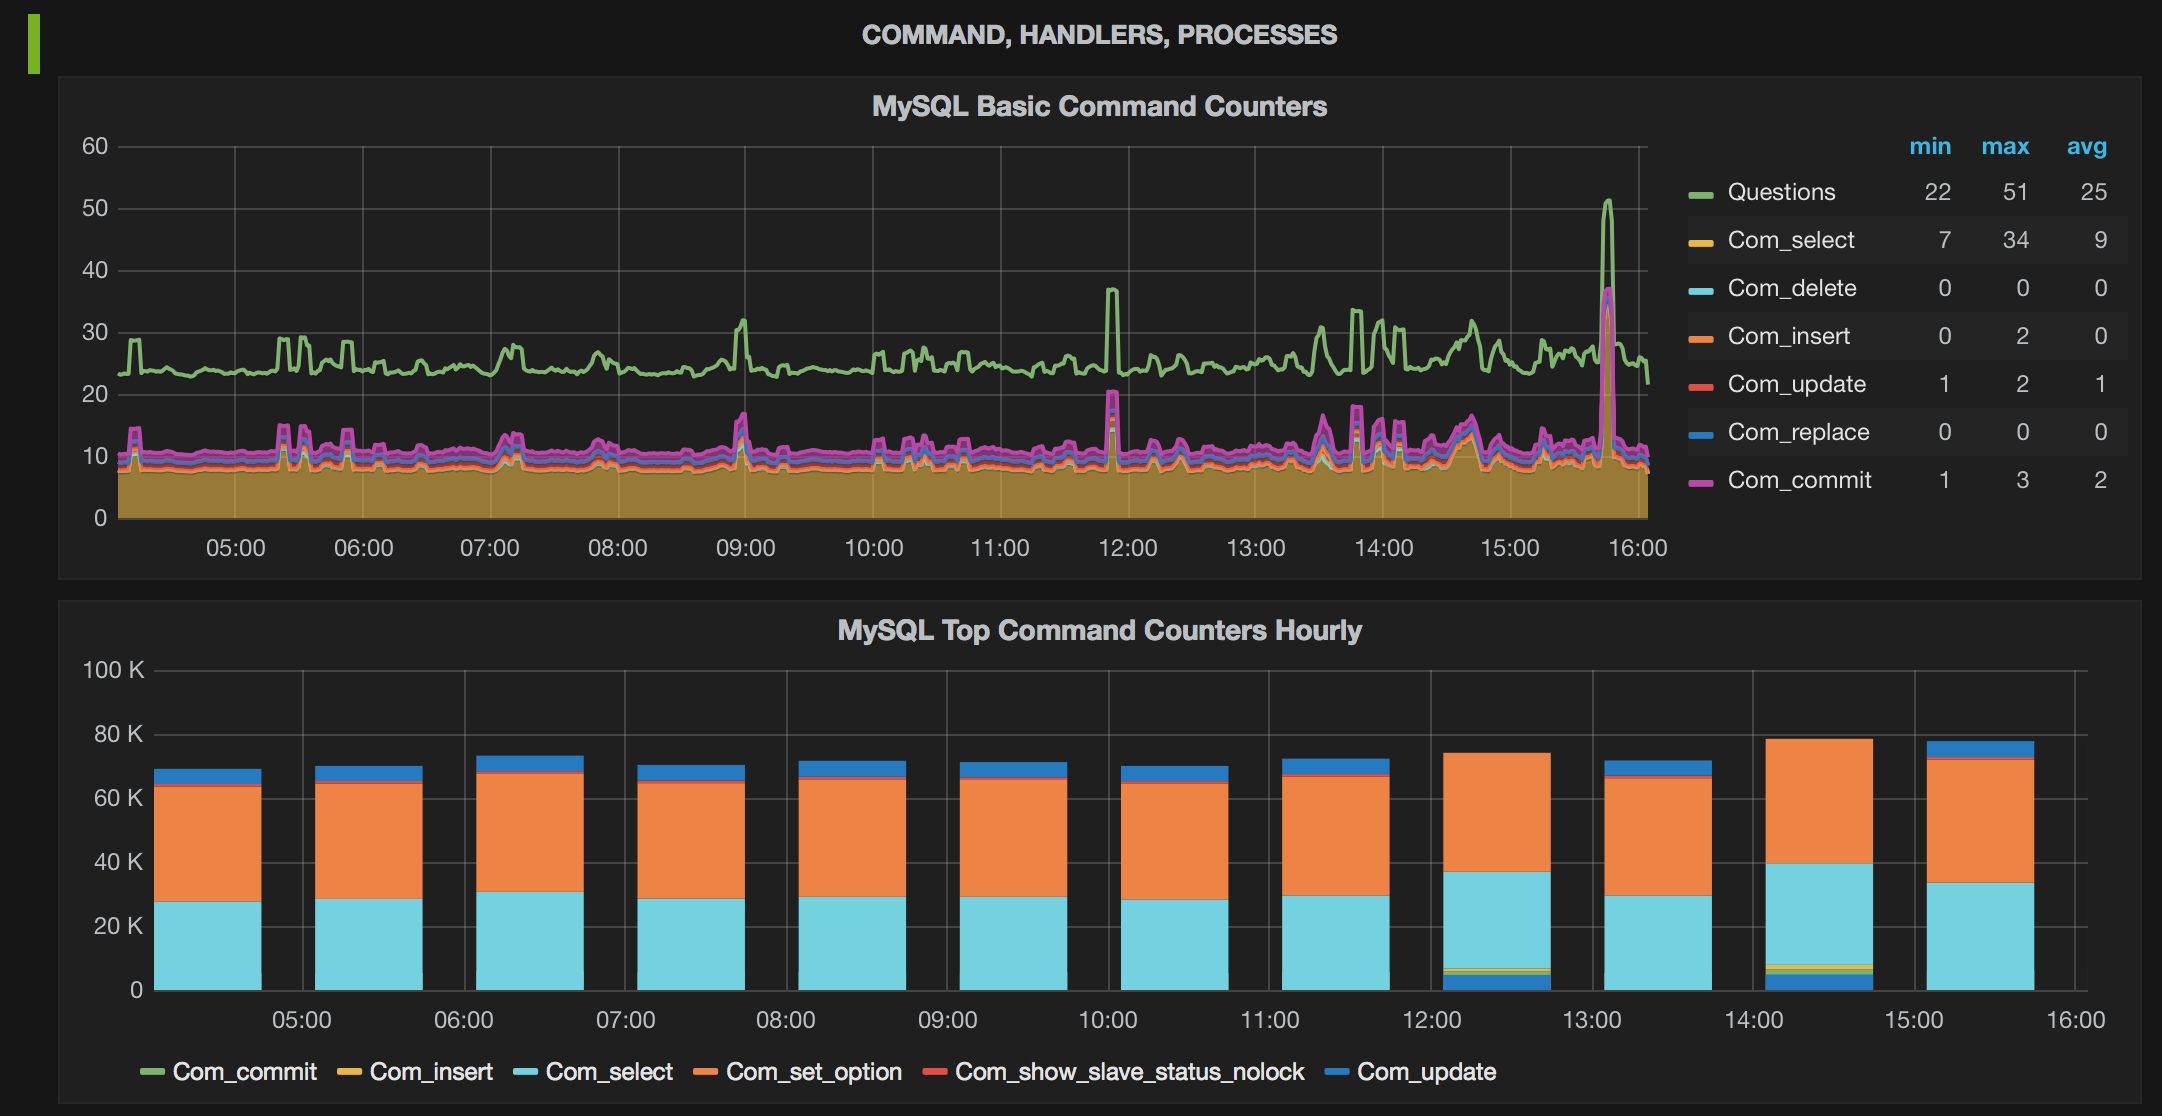
Here is some sample graphs.
If you find a bug in Percona Grafana Dashboards or one of the related projects, you should submit a report to that project's JIRA issue tracker.
Your first step should be to search the existing set of open tickets for a similar report. If you find that someone else has already reported your problem, then you can upvote that report to increase its visibility.
If there is no existing report, submit a report following these steps:
- Sign in to Percona JIRA. You will need to create an account if you do not have one.
- Go to the Create Issue screen and select the relevant project.
- Fill in the fields of Summary, Description, Steps To Reproduce, and Affects Version to the best you can. If the bug corresponds to a crash, attach the stack trace from the logs.
An excellent resource is Elika Etemad's article on filing good bug reports..
As a general rule of thumb, please try to create bug reports that are:
- Reproducible. Include steps to reproduce the problem.
- Specific. Include as much detail as possible: which version, what environment, etc.
- Unique. Do not duplicate existing tickets.
- Scoped to a Single Bug. One bug per report.
