![]()
![]()


Swingspector is a plugin for Intellij IDEA that allows to analyze Java Swing components in a running
application.
It is heavily inspired by the standalone Swing Explorer. (Swing Explorer does come with an Intellij plugin, but it does not offer many features). In fact, the name of the instrumentation agent (SWAG, for SWing AGent), is blatantly copied from that project.
- Display information about swing components in a running application
- Display component hierarchy
- Navigate to point code where components were added
Swingspector adds a new option to run configurations. This option will
instrument the application for use with the plugin.
Select "Swingspector" from the "Modify Options" menu of any run configuration that starts a Swing application, activate the checkbox and choose a shortcut. Now, when running your Swing application through this configuration, it will react to the configured shortcut by opening a tool window in IDEA with information about the Swing component under the mouse cursor.
There are two ways to open a tool window for a component:
The run configuration setup dialog includes a keyboard shortcut (default Ctrl+;). This shortcut is installed in the application being run (so be sure to choose one that doesn't shadow an important shortcut of the application itself).
Position your mouse cursor over a component of interest and press the shortcut keys (with the keyboard focus in your application) to open a window for that component.
The "Swing Roots" toolwindow is populated when running an application with Swingspector active, and contains the root windows (JFrames, Dialogs, …) that the application opened. Double-clicking one of those will open the Swing Hierarchy tool window, showing the tree of components within that window. Individual components can be opened from there.
If the list of windows is empty, press the refresh button once the application is actually showing a window.
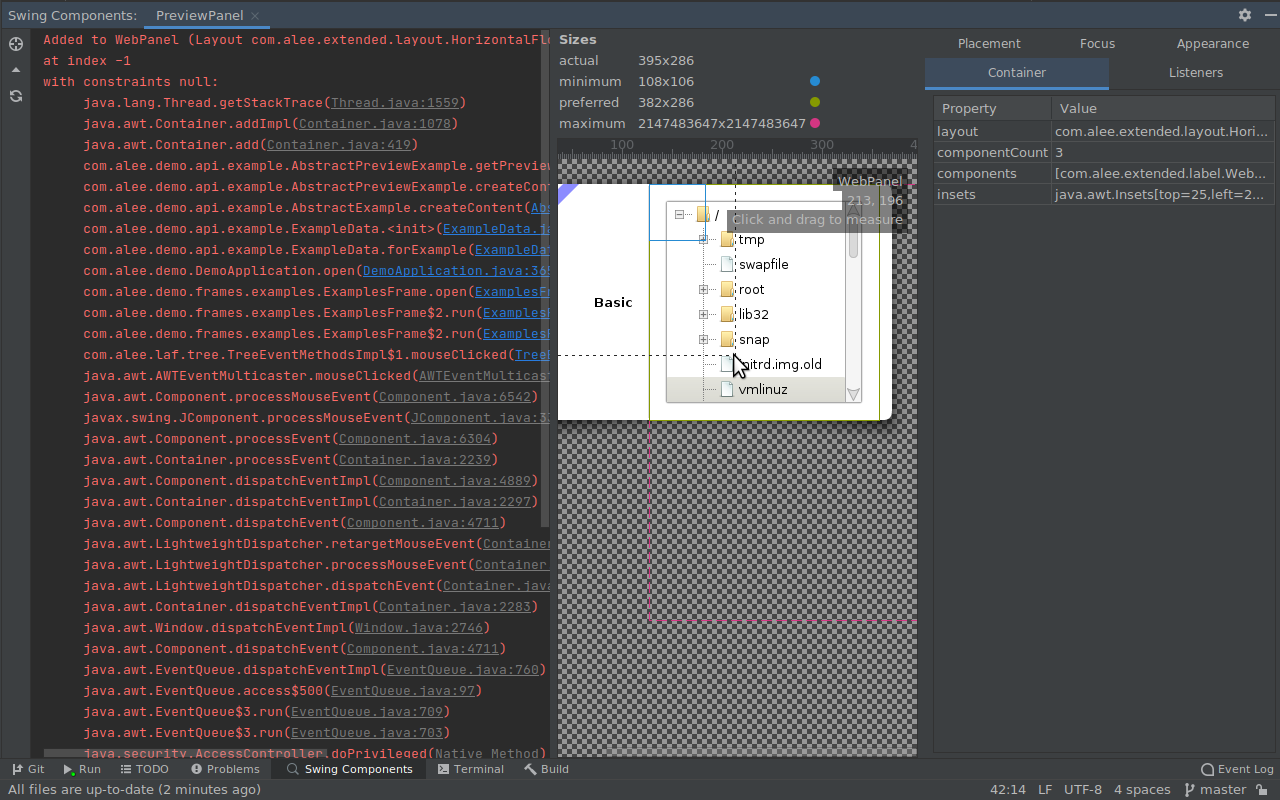 The window contains three sections:
- The placement panel, with information about the way the component was added to the hierarchy, including a stacktrace with clickable source links
- The appearance panel, showing a table of sizes at the top (with a pin if a size was set explicitly) and an interactive view of the component
- The properties panel, with various properties of the component grouped into thematic tabs. The listeners registered on the component (in the listeners tab) can be opened by clicking on them1
The toolbar has buttons to open the component in the hierarchy tree, and to open the component's parent.
Immediate child components can be opened by double-clicking. When hovering over a child component, its preferred, minimum, and maximum size are plotted, and its name is displayed in the overlay.
-
Using IDE built-in plugin system:
Settings/Preferences > Plugins > Marketplace > Search for " Swingspector" > Install Plugin
-
Manually:
Download the latest release and install it manually using Settings/Preferences > Plugins > ⚙️ > Install plugin from disk...
Plugin based on the IntelliJ Platform Plugin Template.
Footnotes
-
This currently only works for regular classes (including inner classes and anonymous classes), but not method references or lambda expressions. ↩