
Using Amazon data to predict if the review is negative or positive
- If rating <=3 negative review 0
- If rating >=4 positive review 1
This part is to use the users' review to predict the rating scores and the label(target) in this part is the rating score from 1 to 5. This is multi-class classification
- helpful - helpfulness rating of the review [2,3], e.g. 2/3 , 2 is numerator , 3 id denominator Numerator: Number of readers who found the review is helpful Denominator: Number of readers who indicated whether they found the review helpful or not.
- review Text - text of the review
- overall - rating of the product
- summary - summary of the review
- unix Review Time - time of the review (unix time)
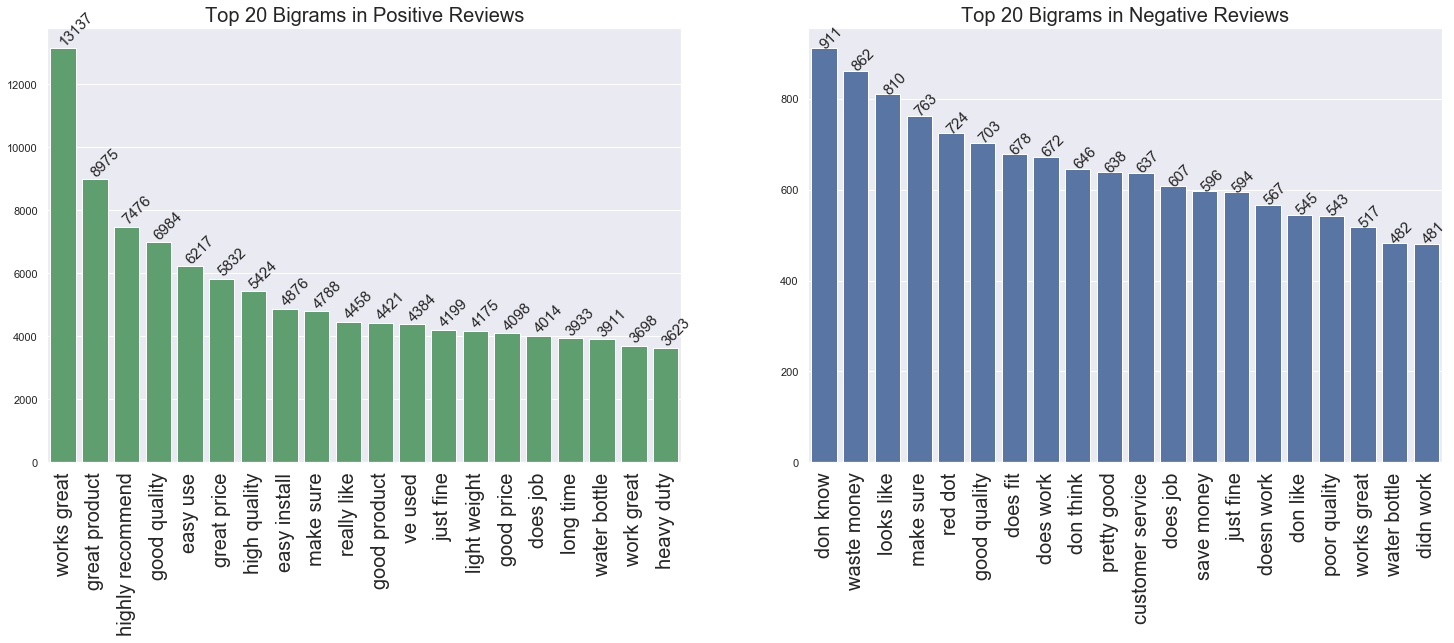
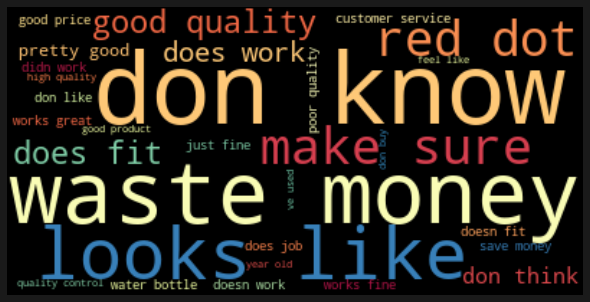
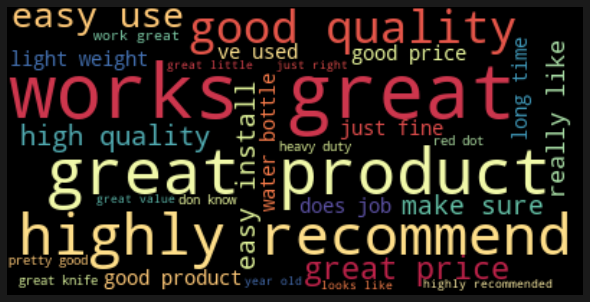
- Bigrams Shows that Top 5 words for positive reviews are all positive, on the other hand top 5 words for negative reviews either neutral or negative.


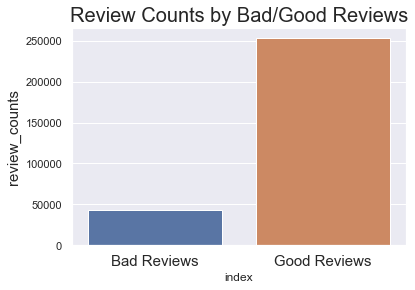
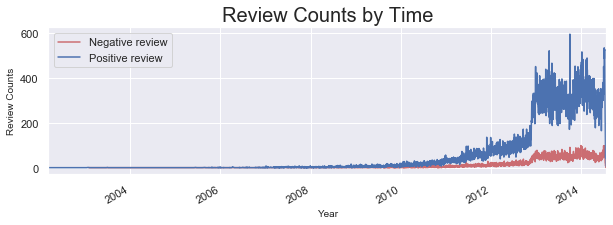
- Review counts graph shows that the numbers of positive reviews and negative reviews are not balanced, therefore oversampling method was applied.

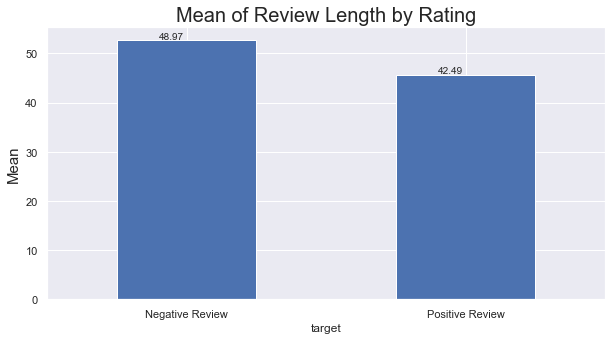
- On the other hand we can see the mean of length of negative reviews is long than positive reviews. That makes sense, because when a person complains about a product that she/he does like , the person will talk a lot.

- In 2013 Amazon sells over 200 million products in the USA, which are categorised into 35 departments and almost 20 million in Sports & Outdoors

- Combined summary column and review column as “combined_text”
- Created a target column based on rating column
- Created two columns, one is helpfulness_numerator ,another one is helpfulness_denominator
- Tokenization, Punctuation removal , stemming, lemmatization
- After step 4. created a column - review_len which is length of review(text)
- Data Resampling (Oversampling Method)
There are two parts at first level, text data analysis and non_text data analysis. For text data , Naive Bayes Classifier, Neural Network and Logistic Regression were applies and obtained each model's predictions (train data and test data ). For the non_text data, Random Forest , Neural Network and Logistic Regression were applied and generated the predictions. At second level, All six train-data predictions and six test-data prediction were combined as new features renamed as new x_train data and new x_text data. XGboost and Neural Network were applied to predict again. The result shows that model stacking gives slightly higher f1 score from 0.9059 to 0.9063. Eventhough model stacking may deliver better result, it is difficult to interpret the result.

Similary, this part contians two parts, in the first modeling part, Naive Bayes Classifier, Neural Network and Random Forest were applied and second part is included model stacking with XGboost model and Neural Network. In the first part, the F1 scores of Naive Bayes Classifier, Neural Network and Random Forest are 0.6067, 0.6085, 0.6186 respectively. Obviously Random Forest perfomed best with f1 score 0.6186. In second part, after model stacking the f1 scores of XGboost and Neural Network are 0.5893 and 0.6189. After model stacking we can see that f1 score slightly increased 0.0003.
