/dataviz-cheatsheet

A variety of charts with a simple R code.

Primary LanguageR

Data Viz cheatsheet

Overview

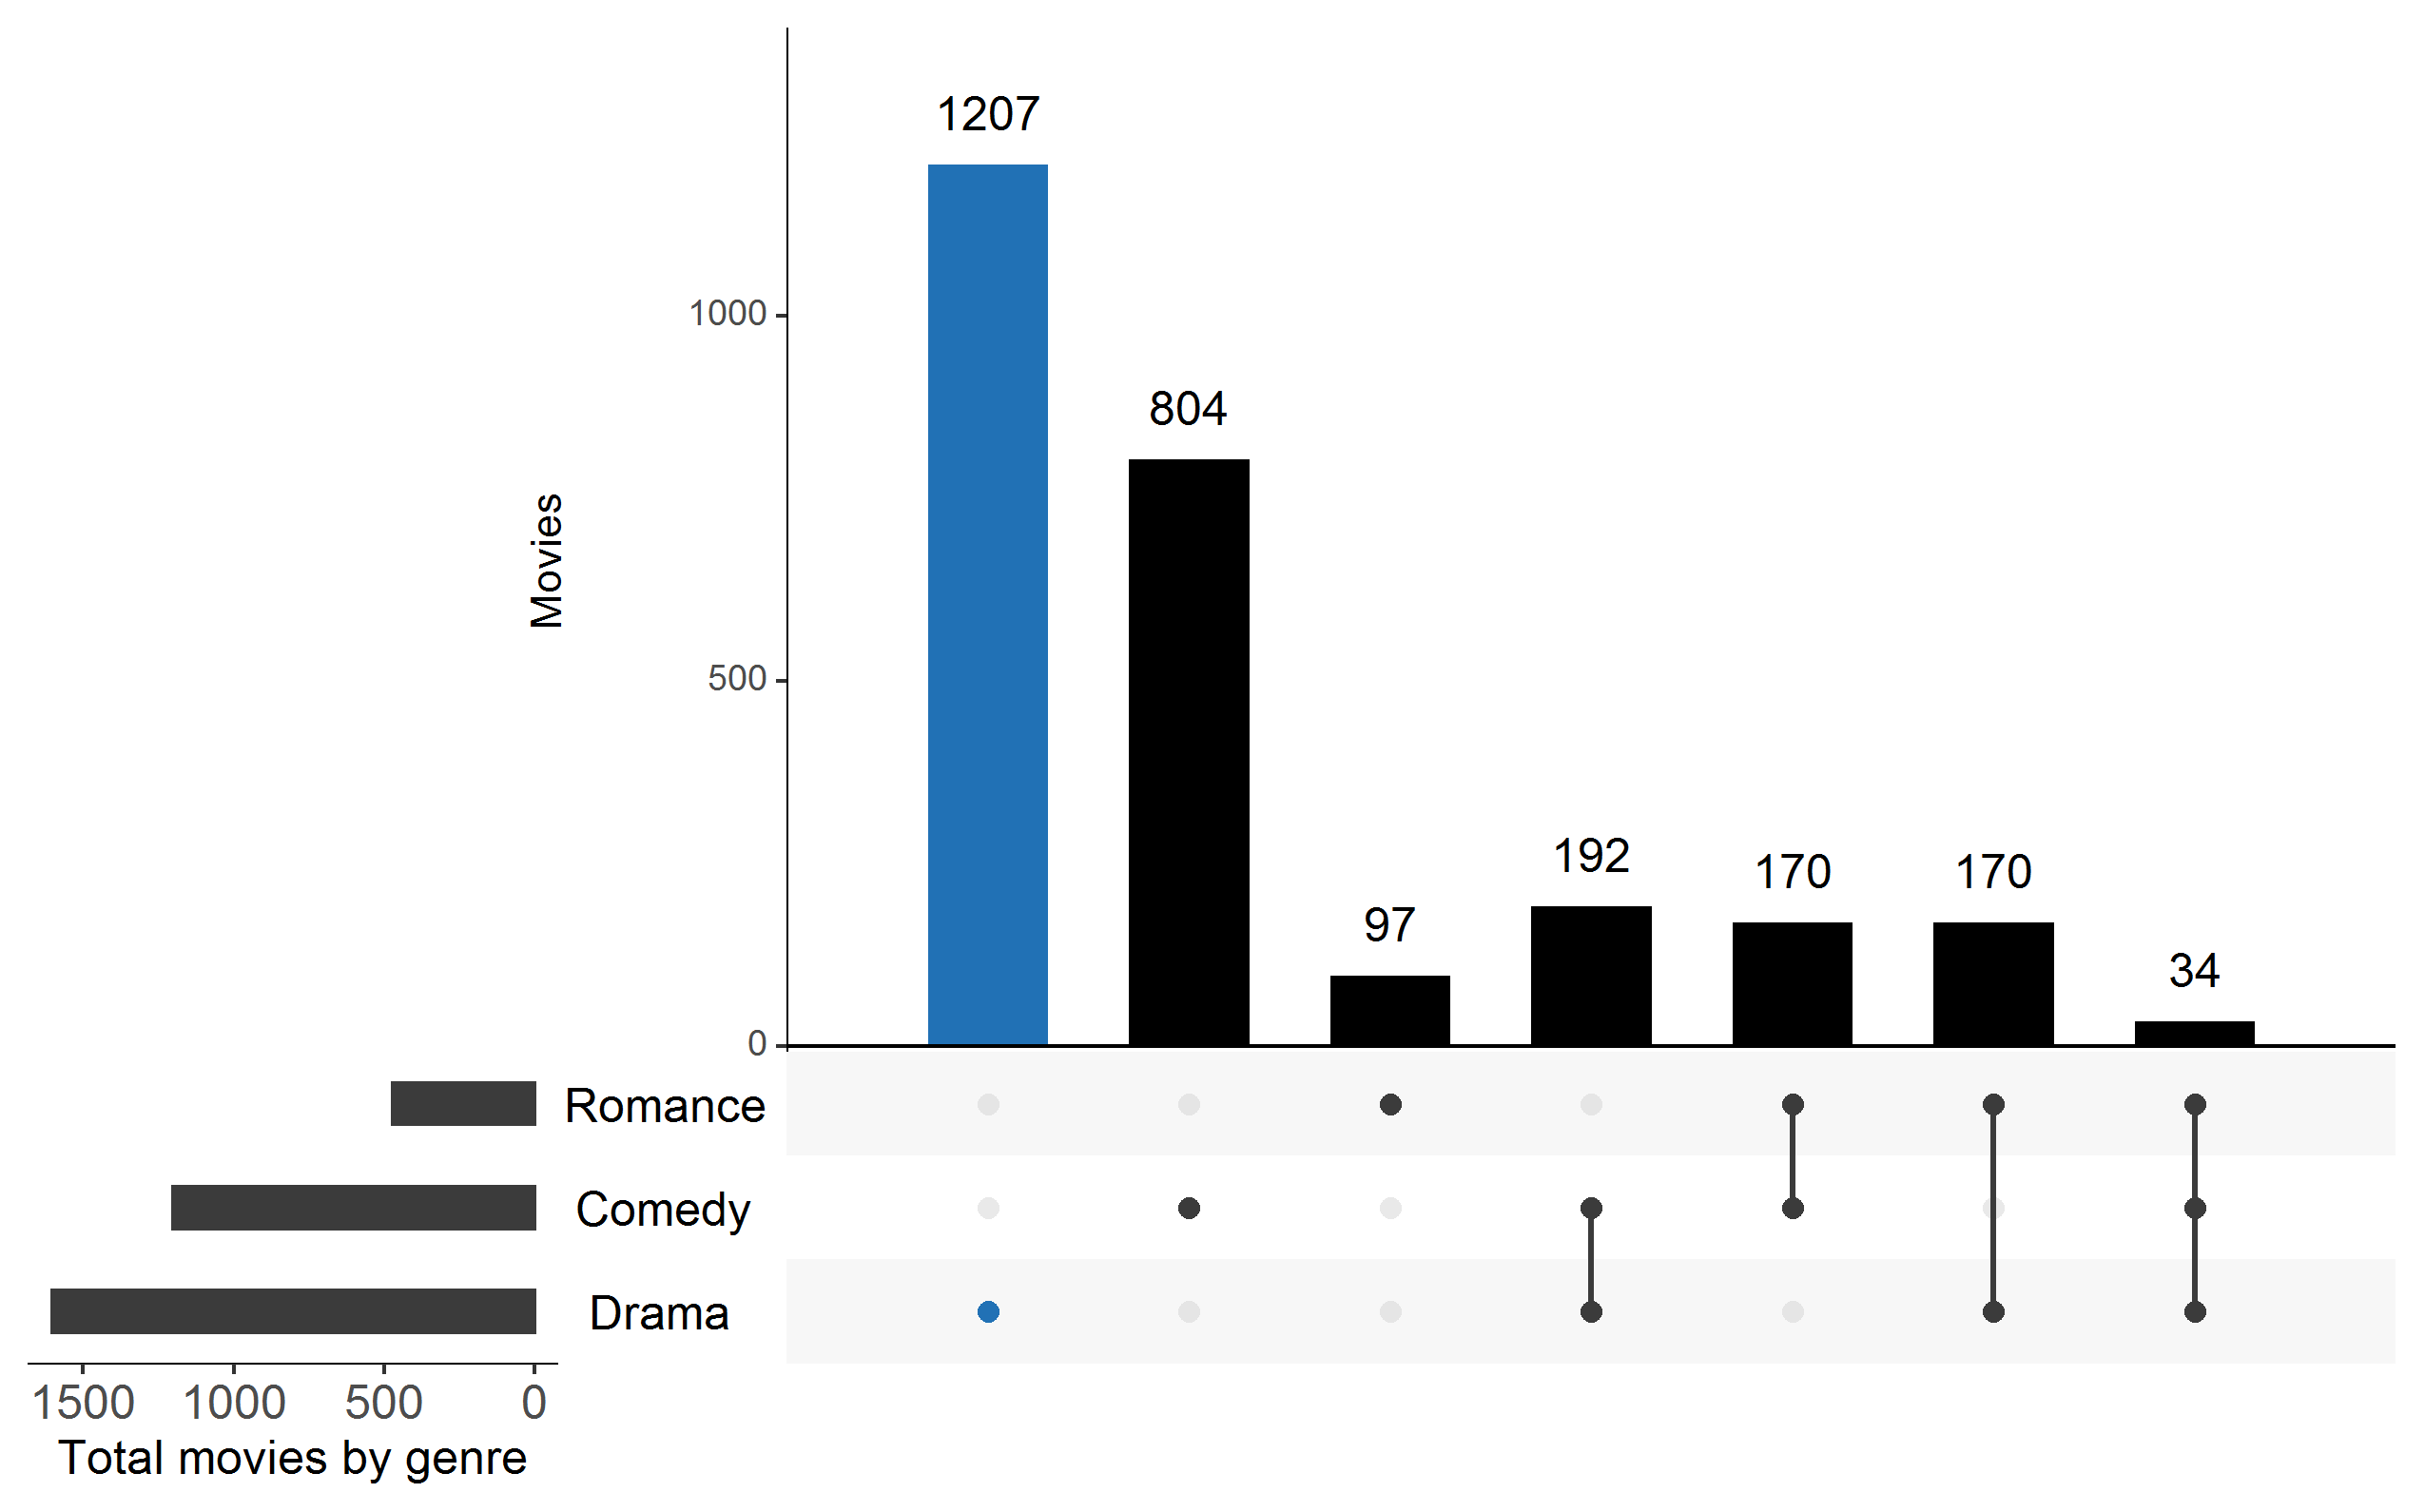
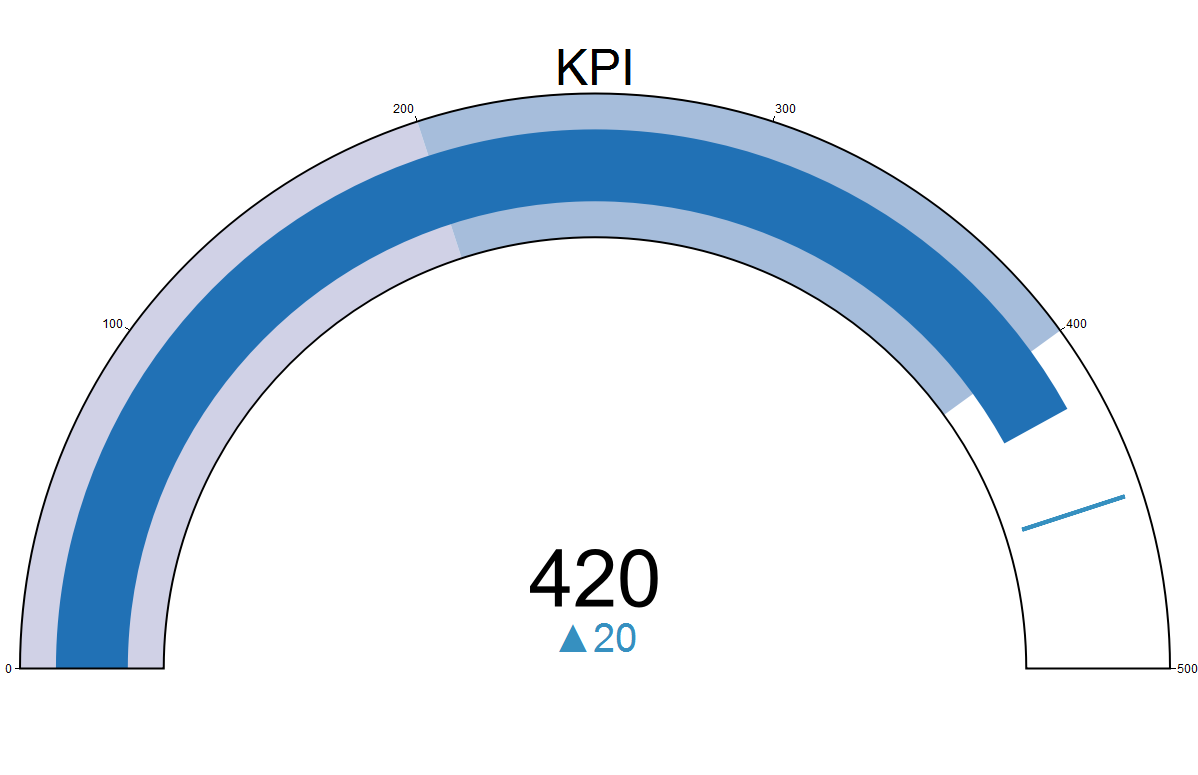
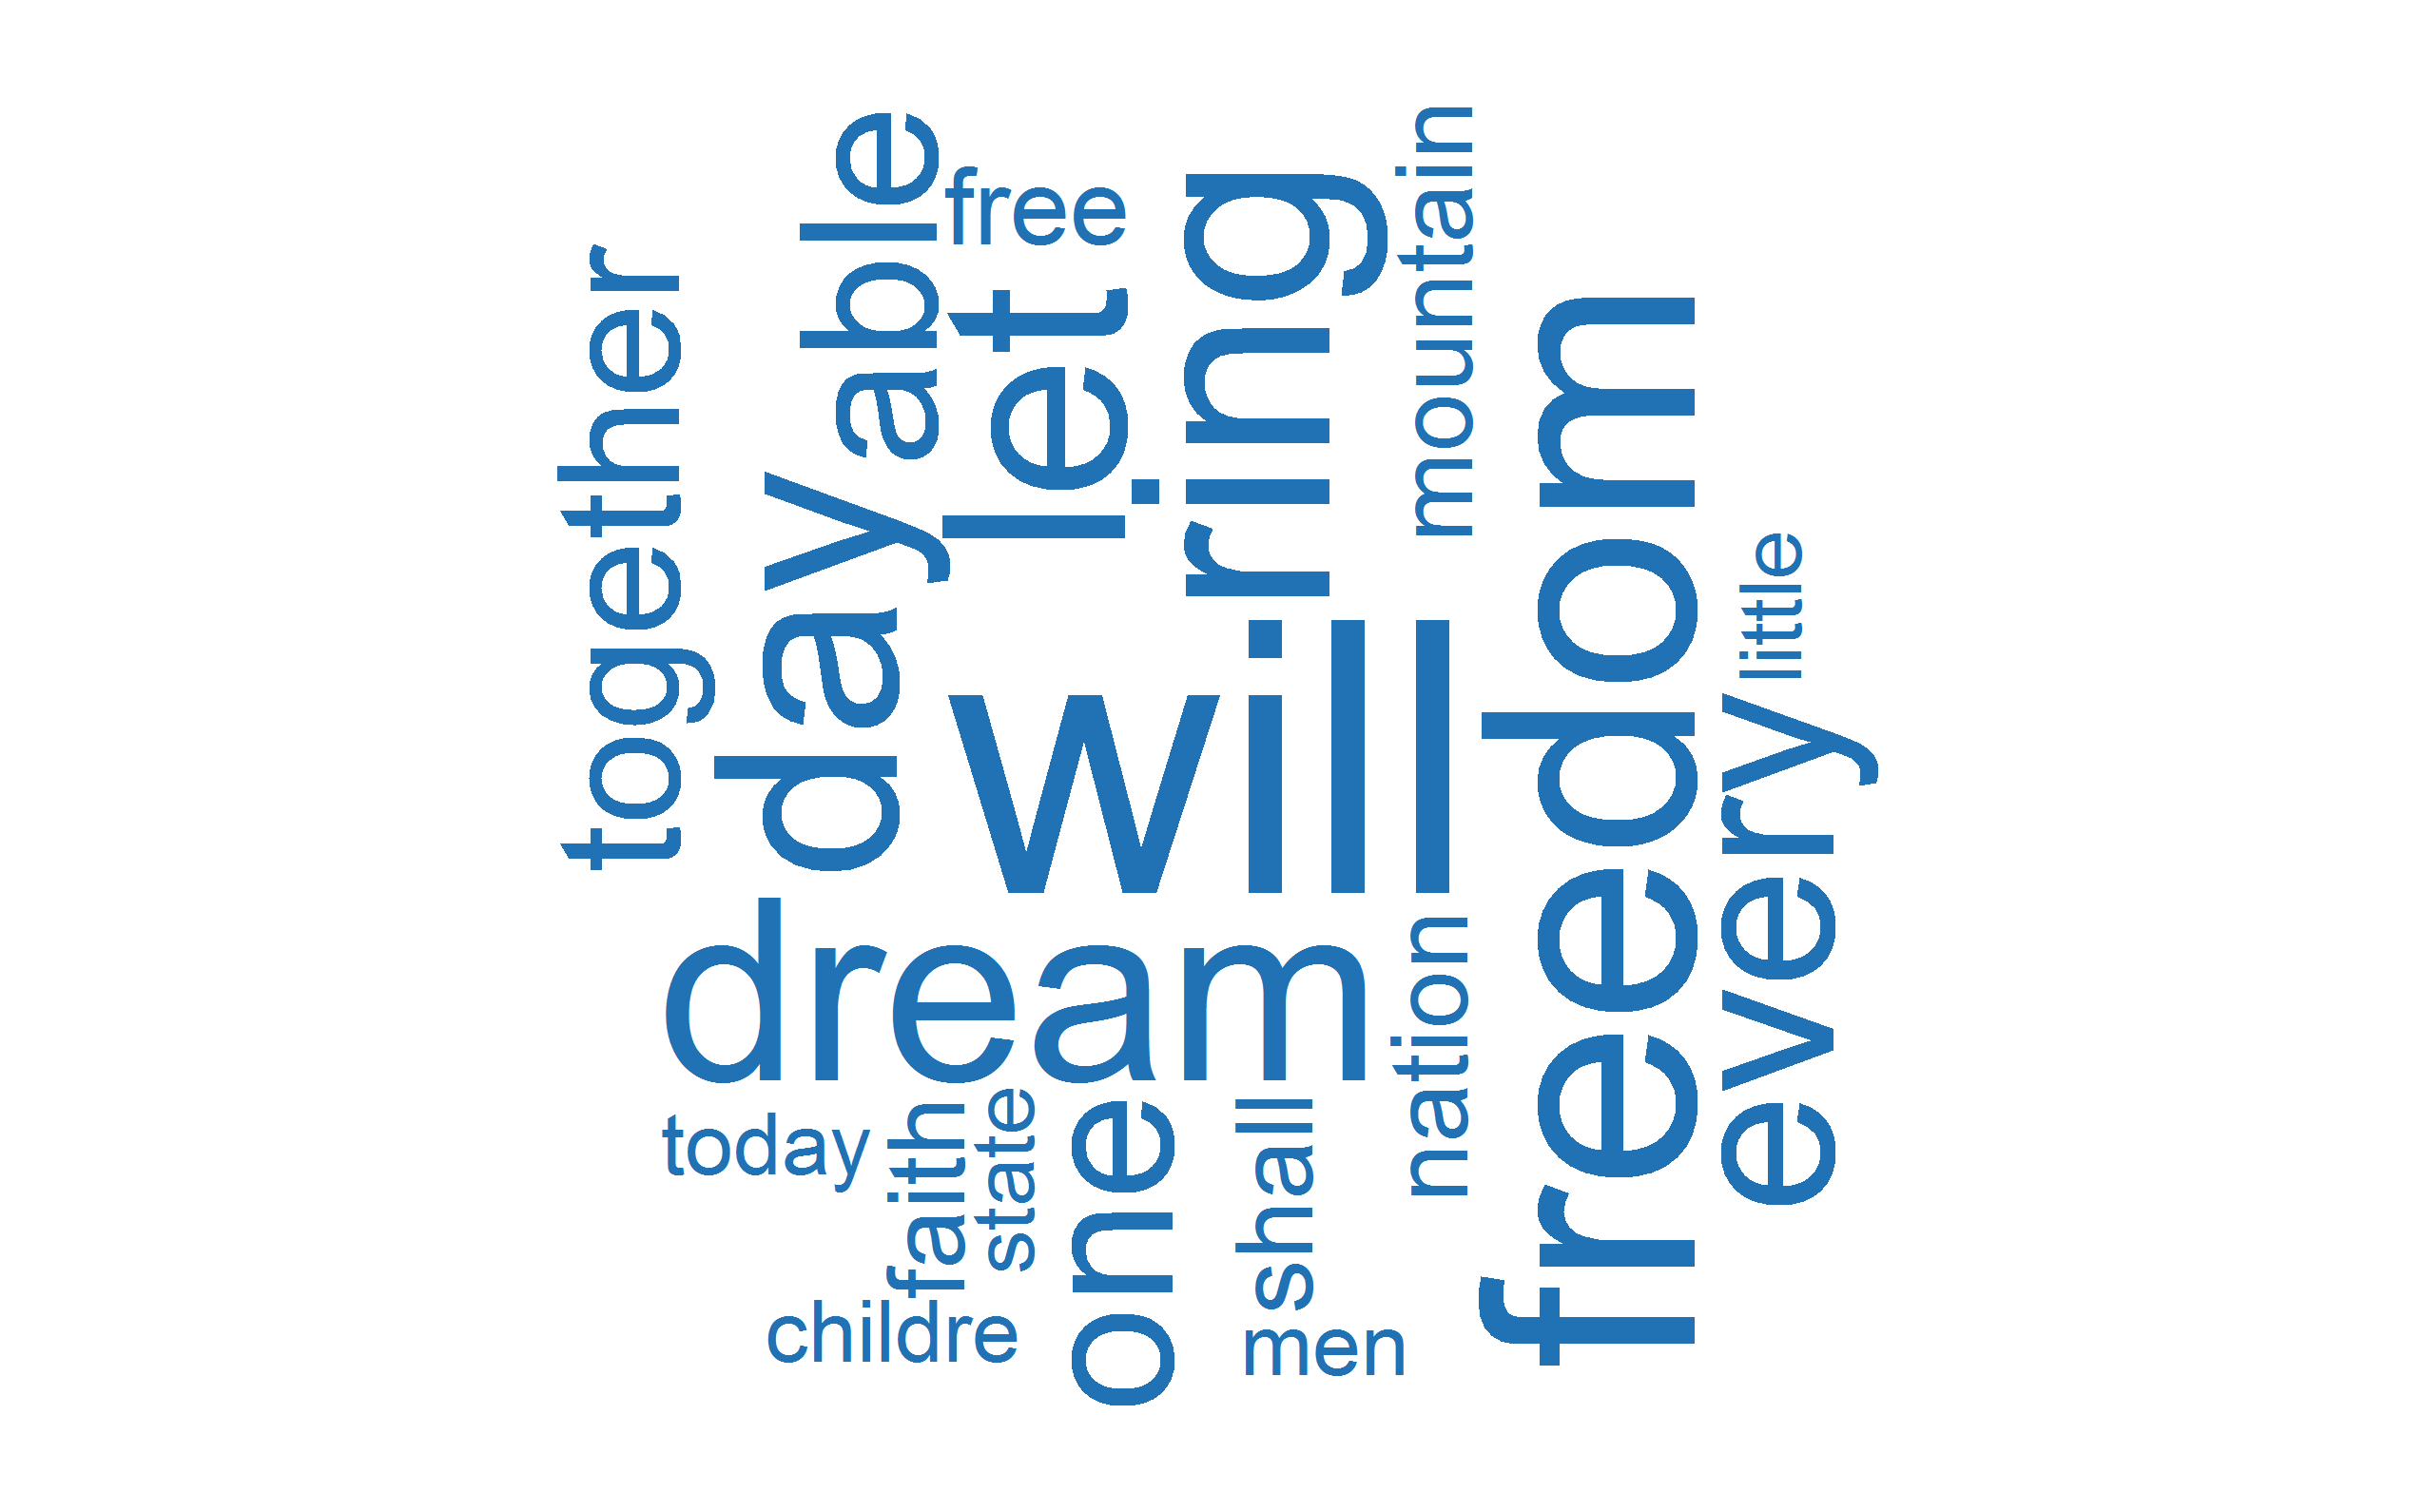
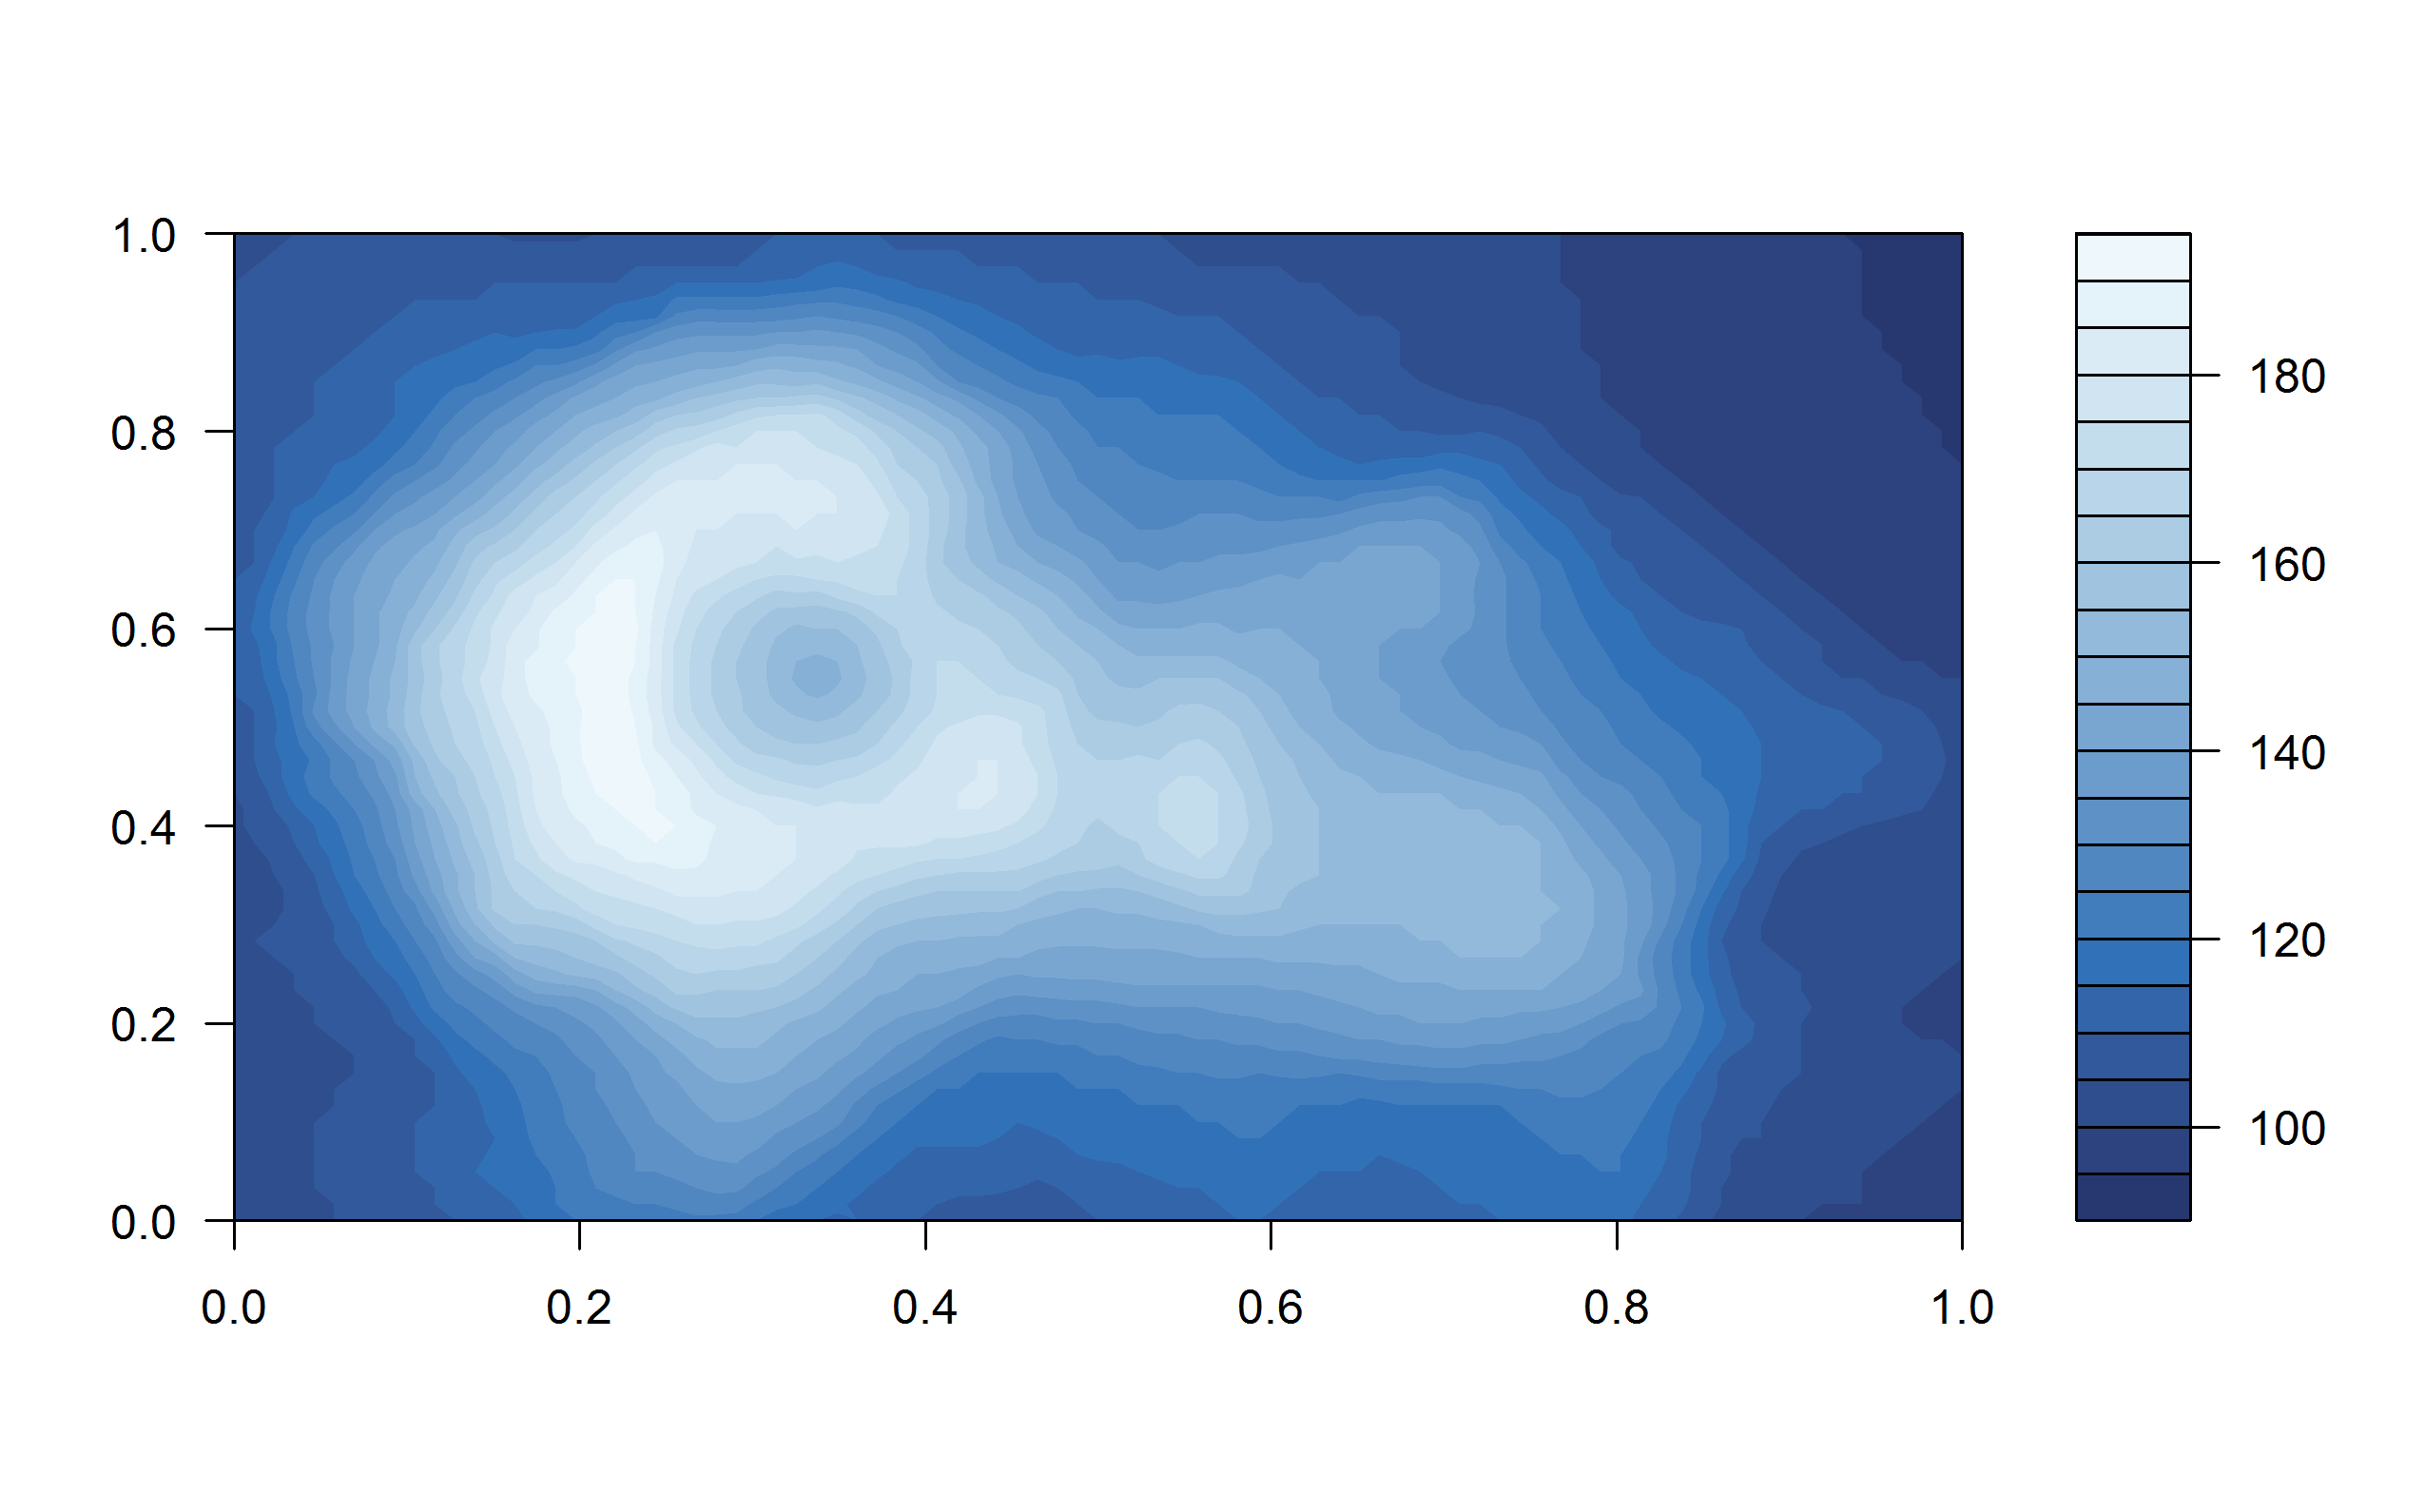
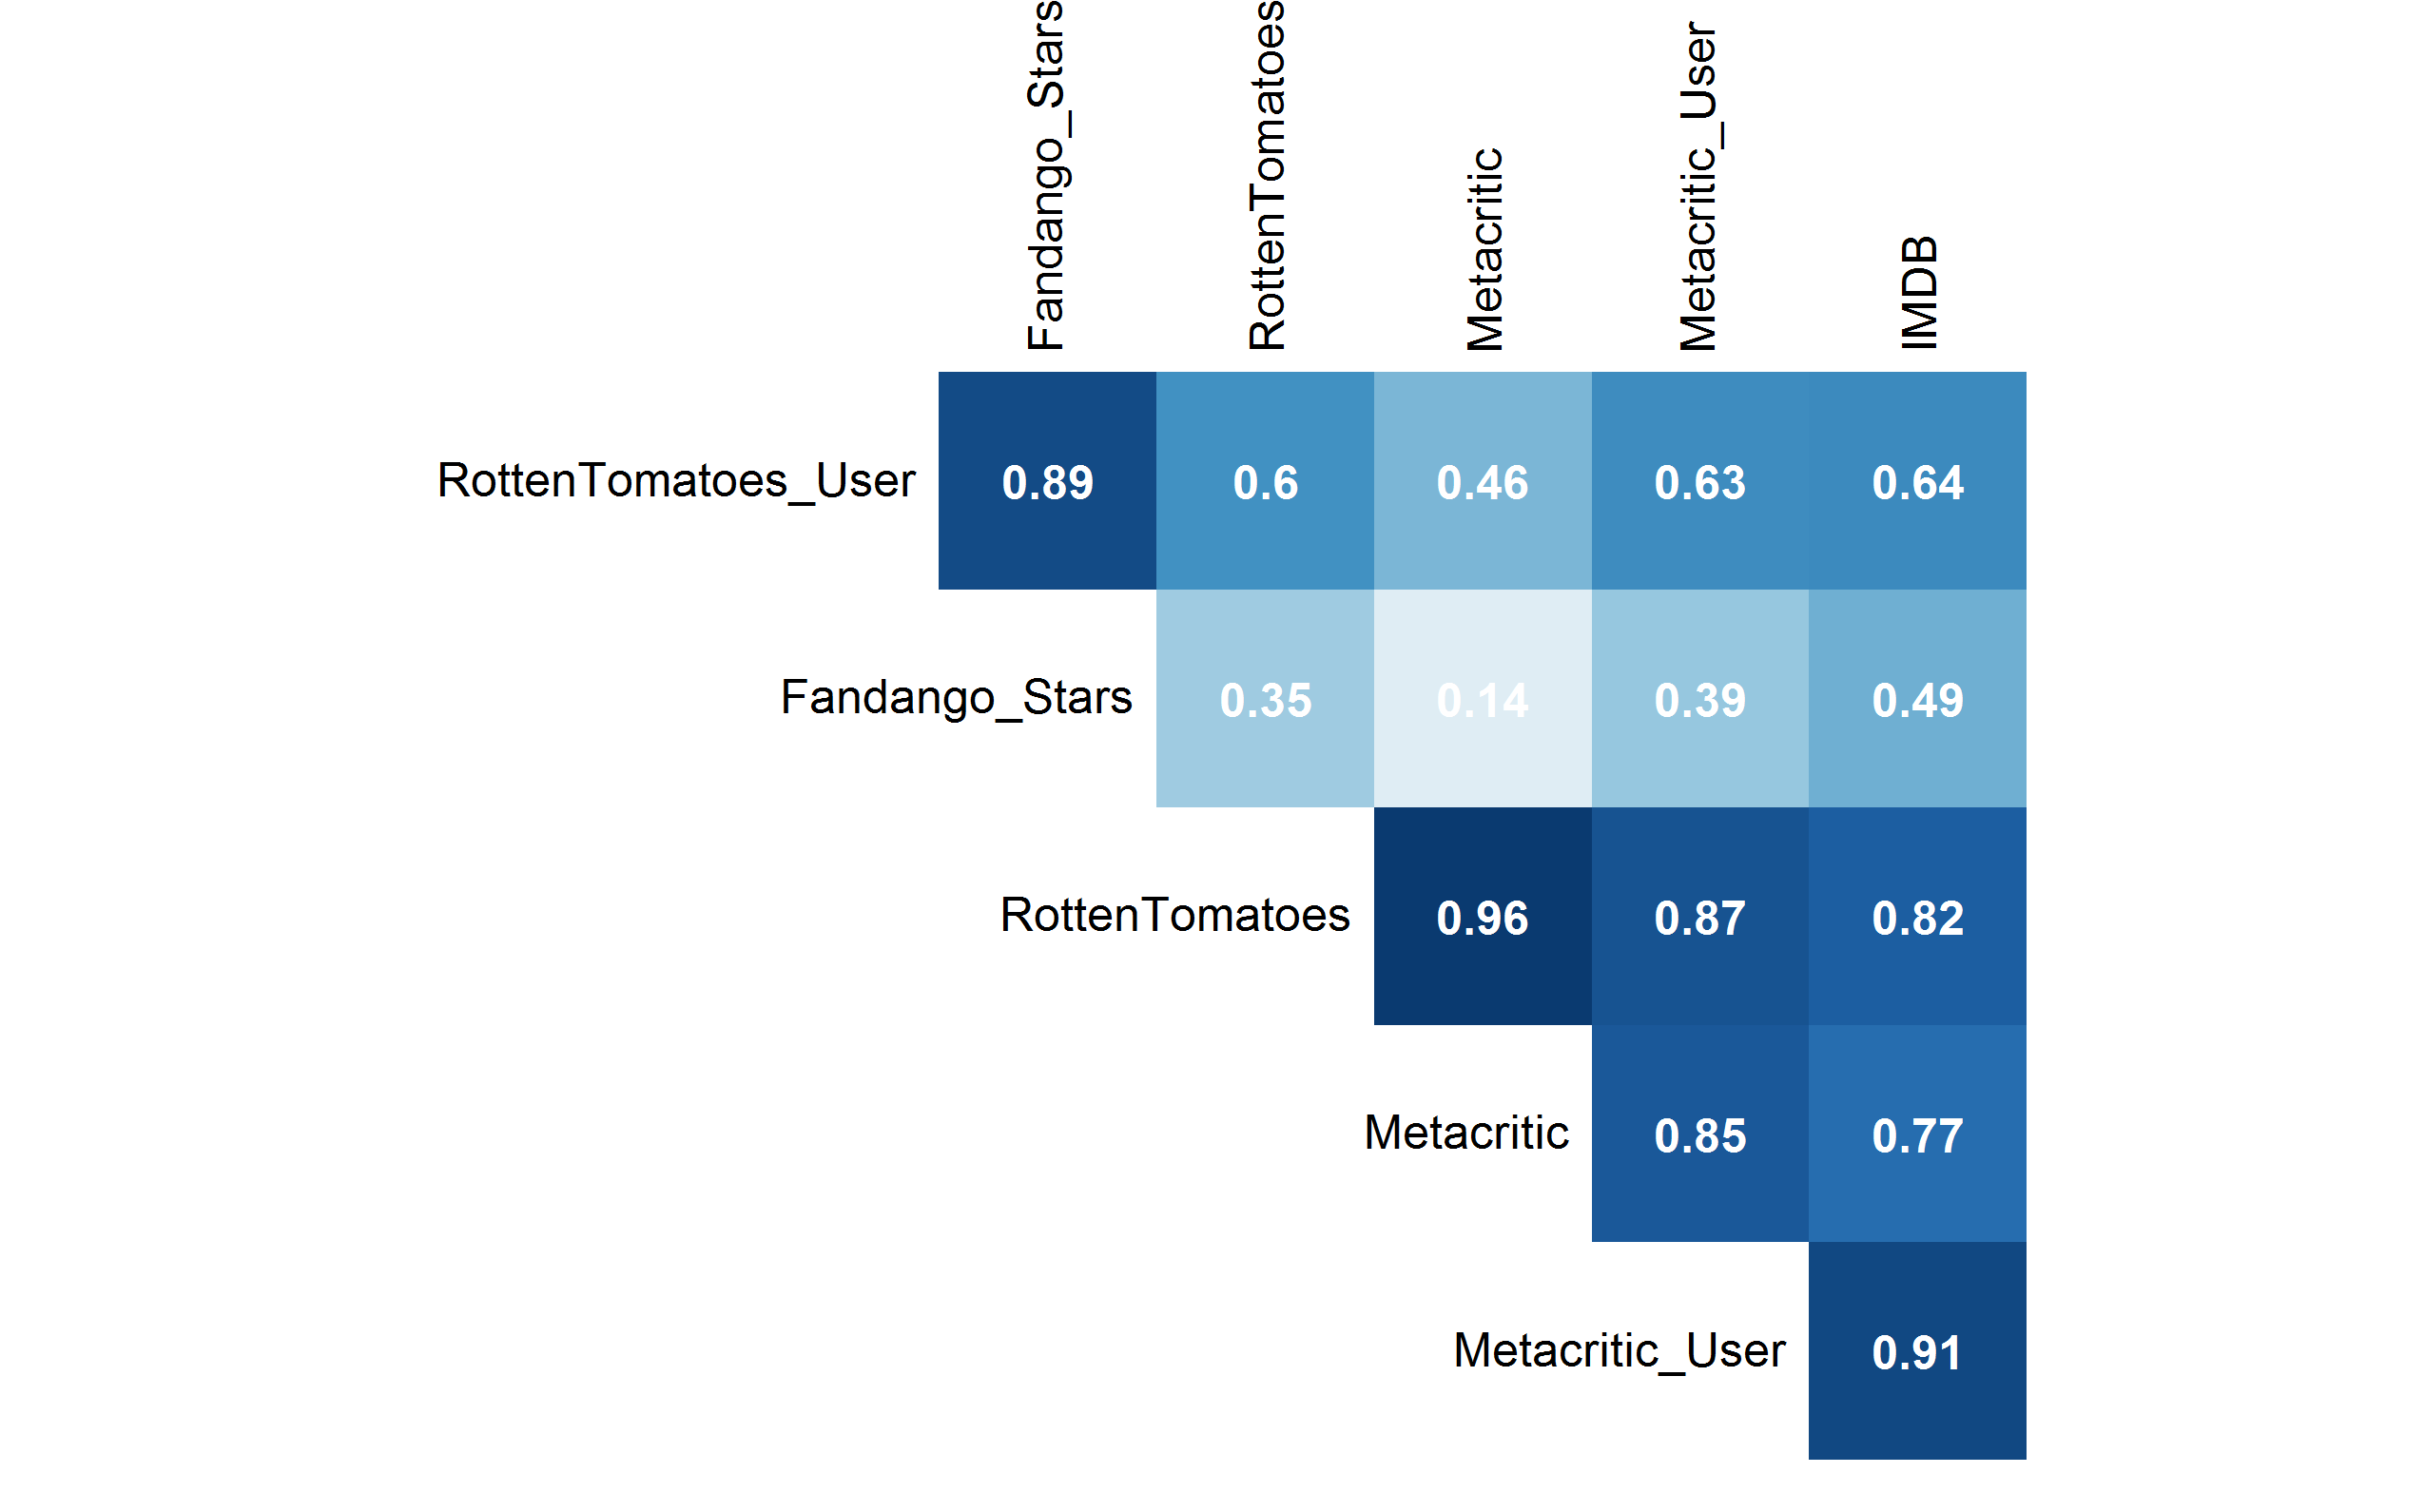
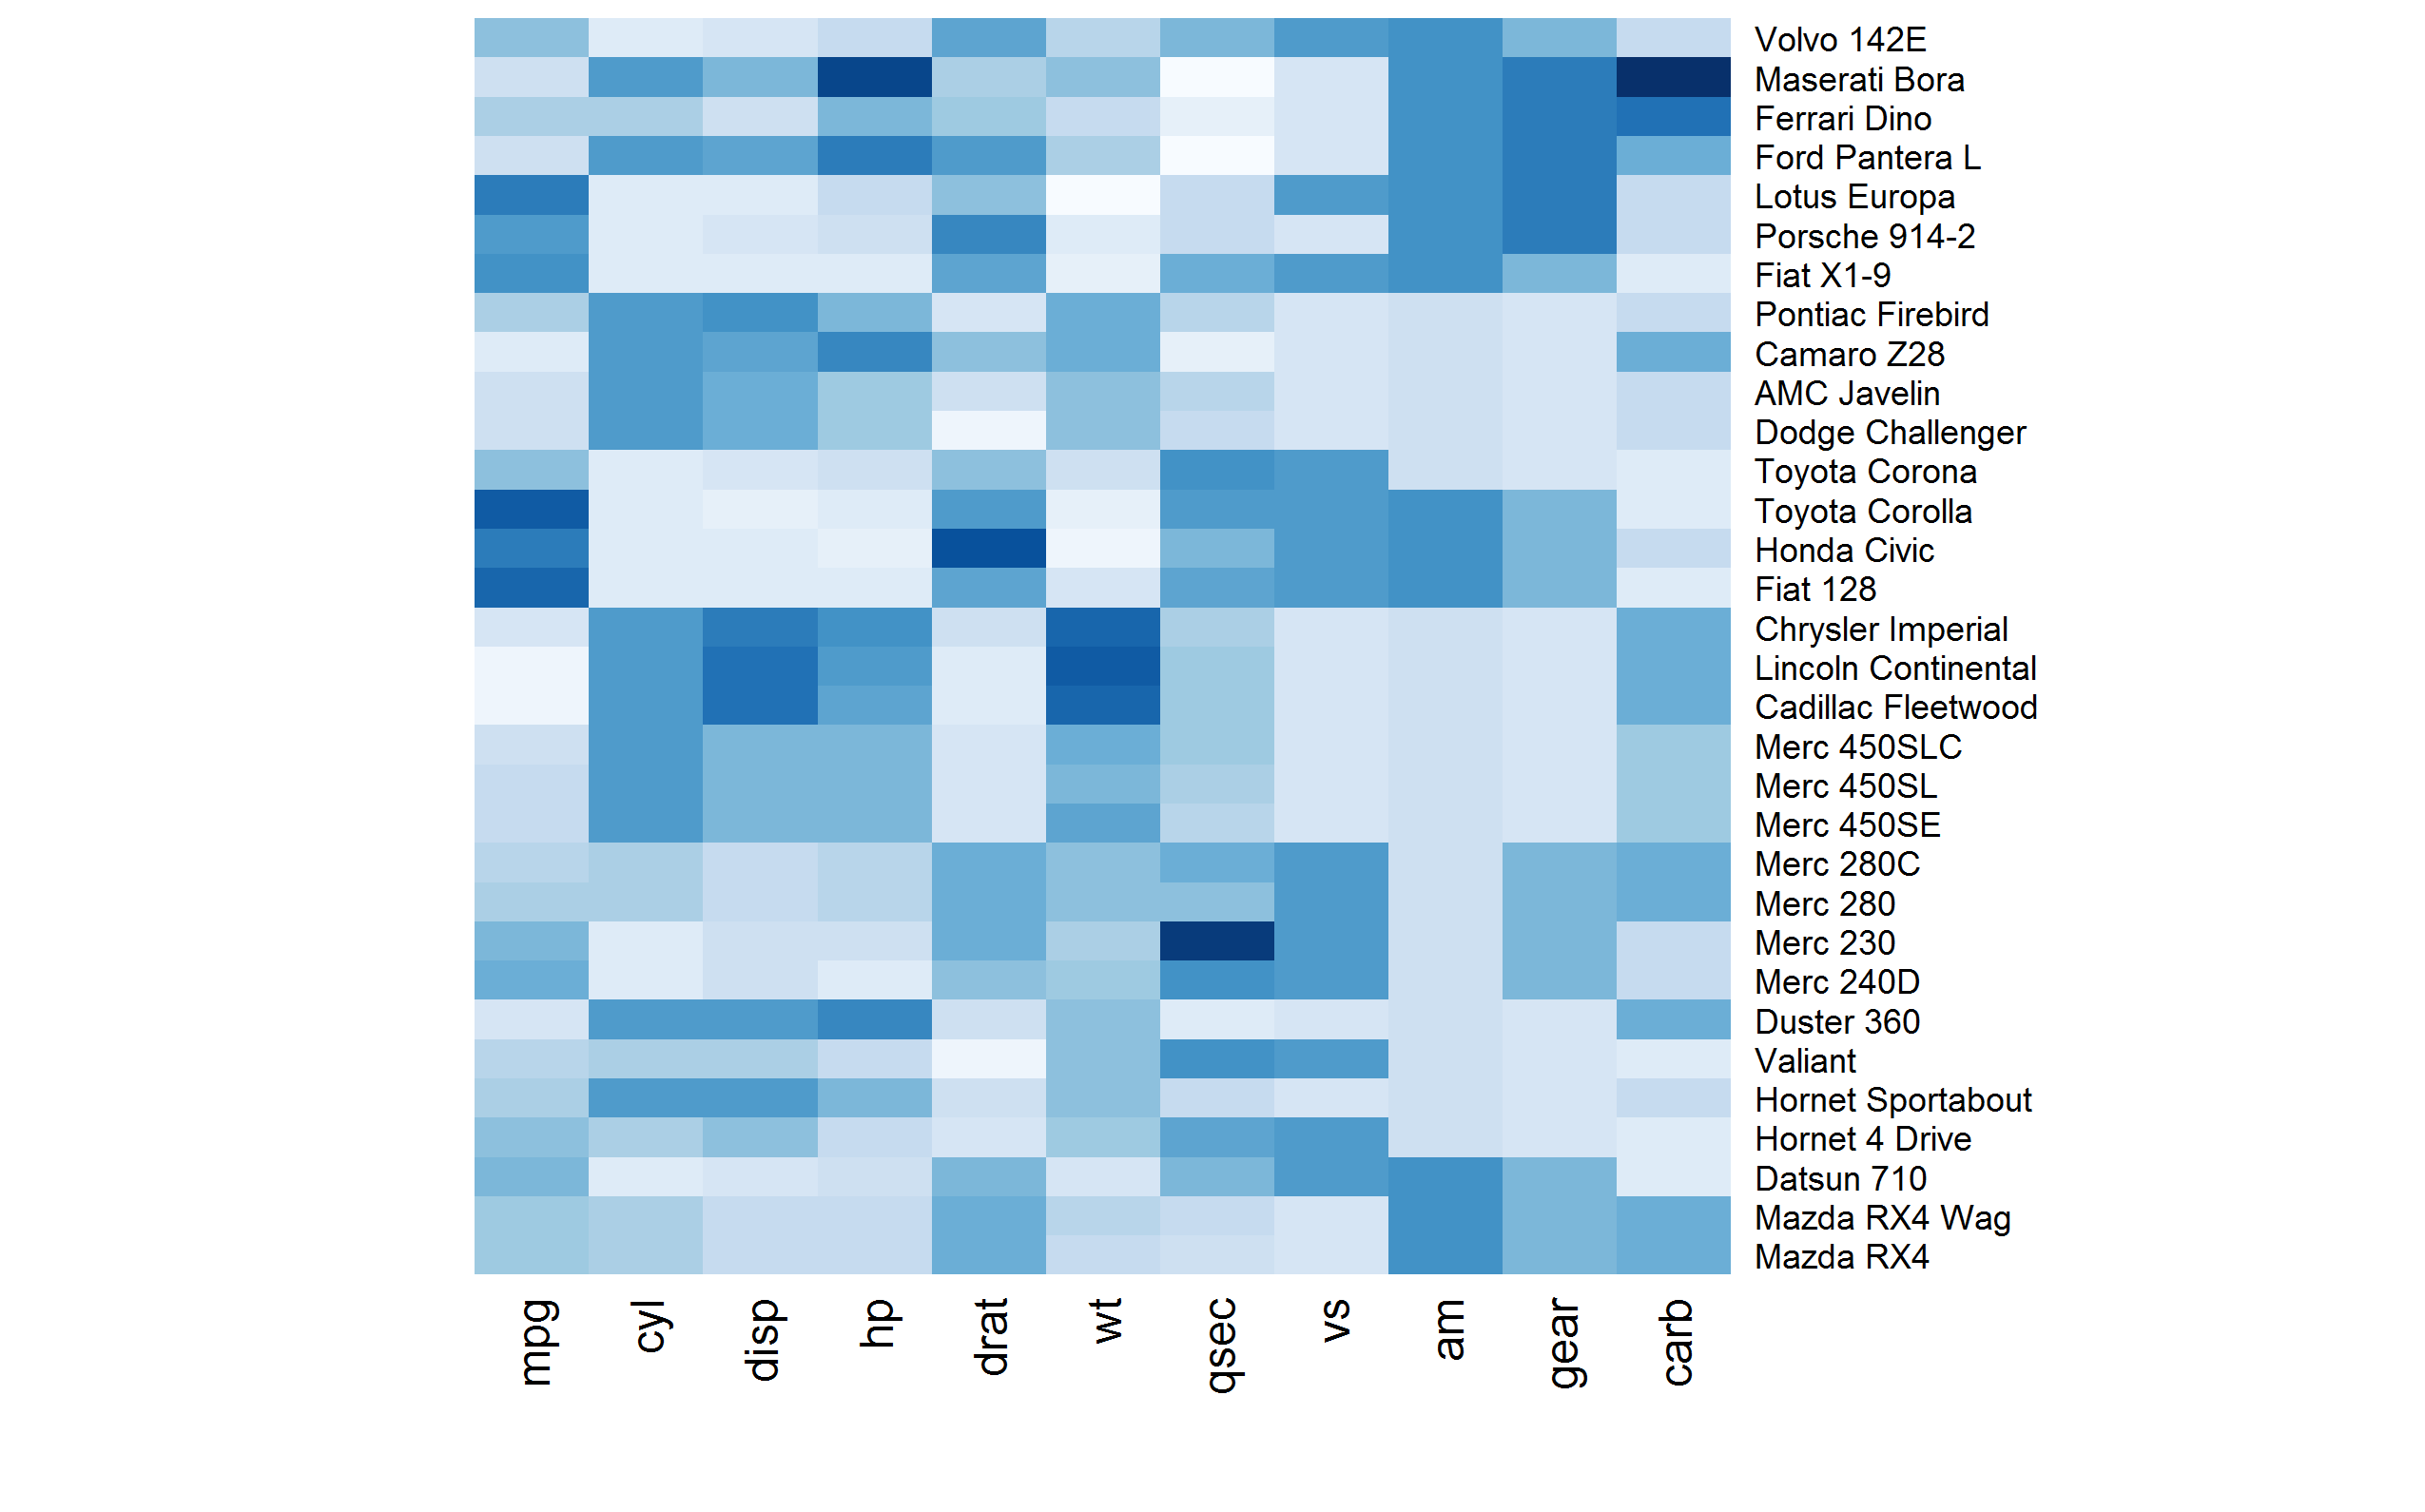
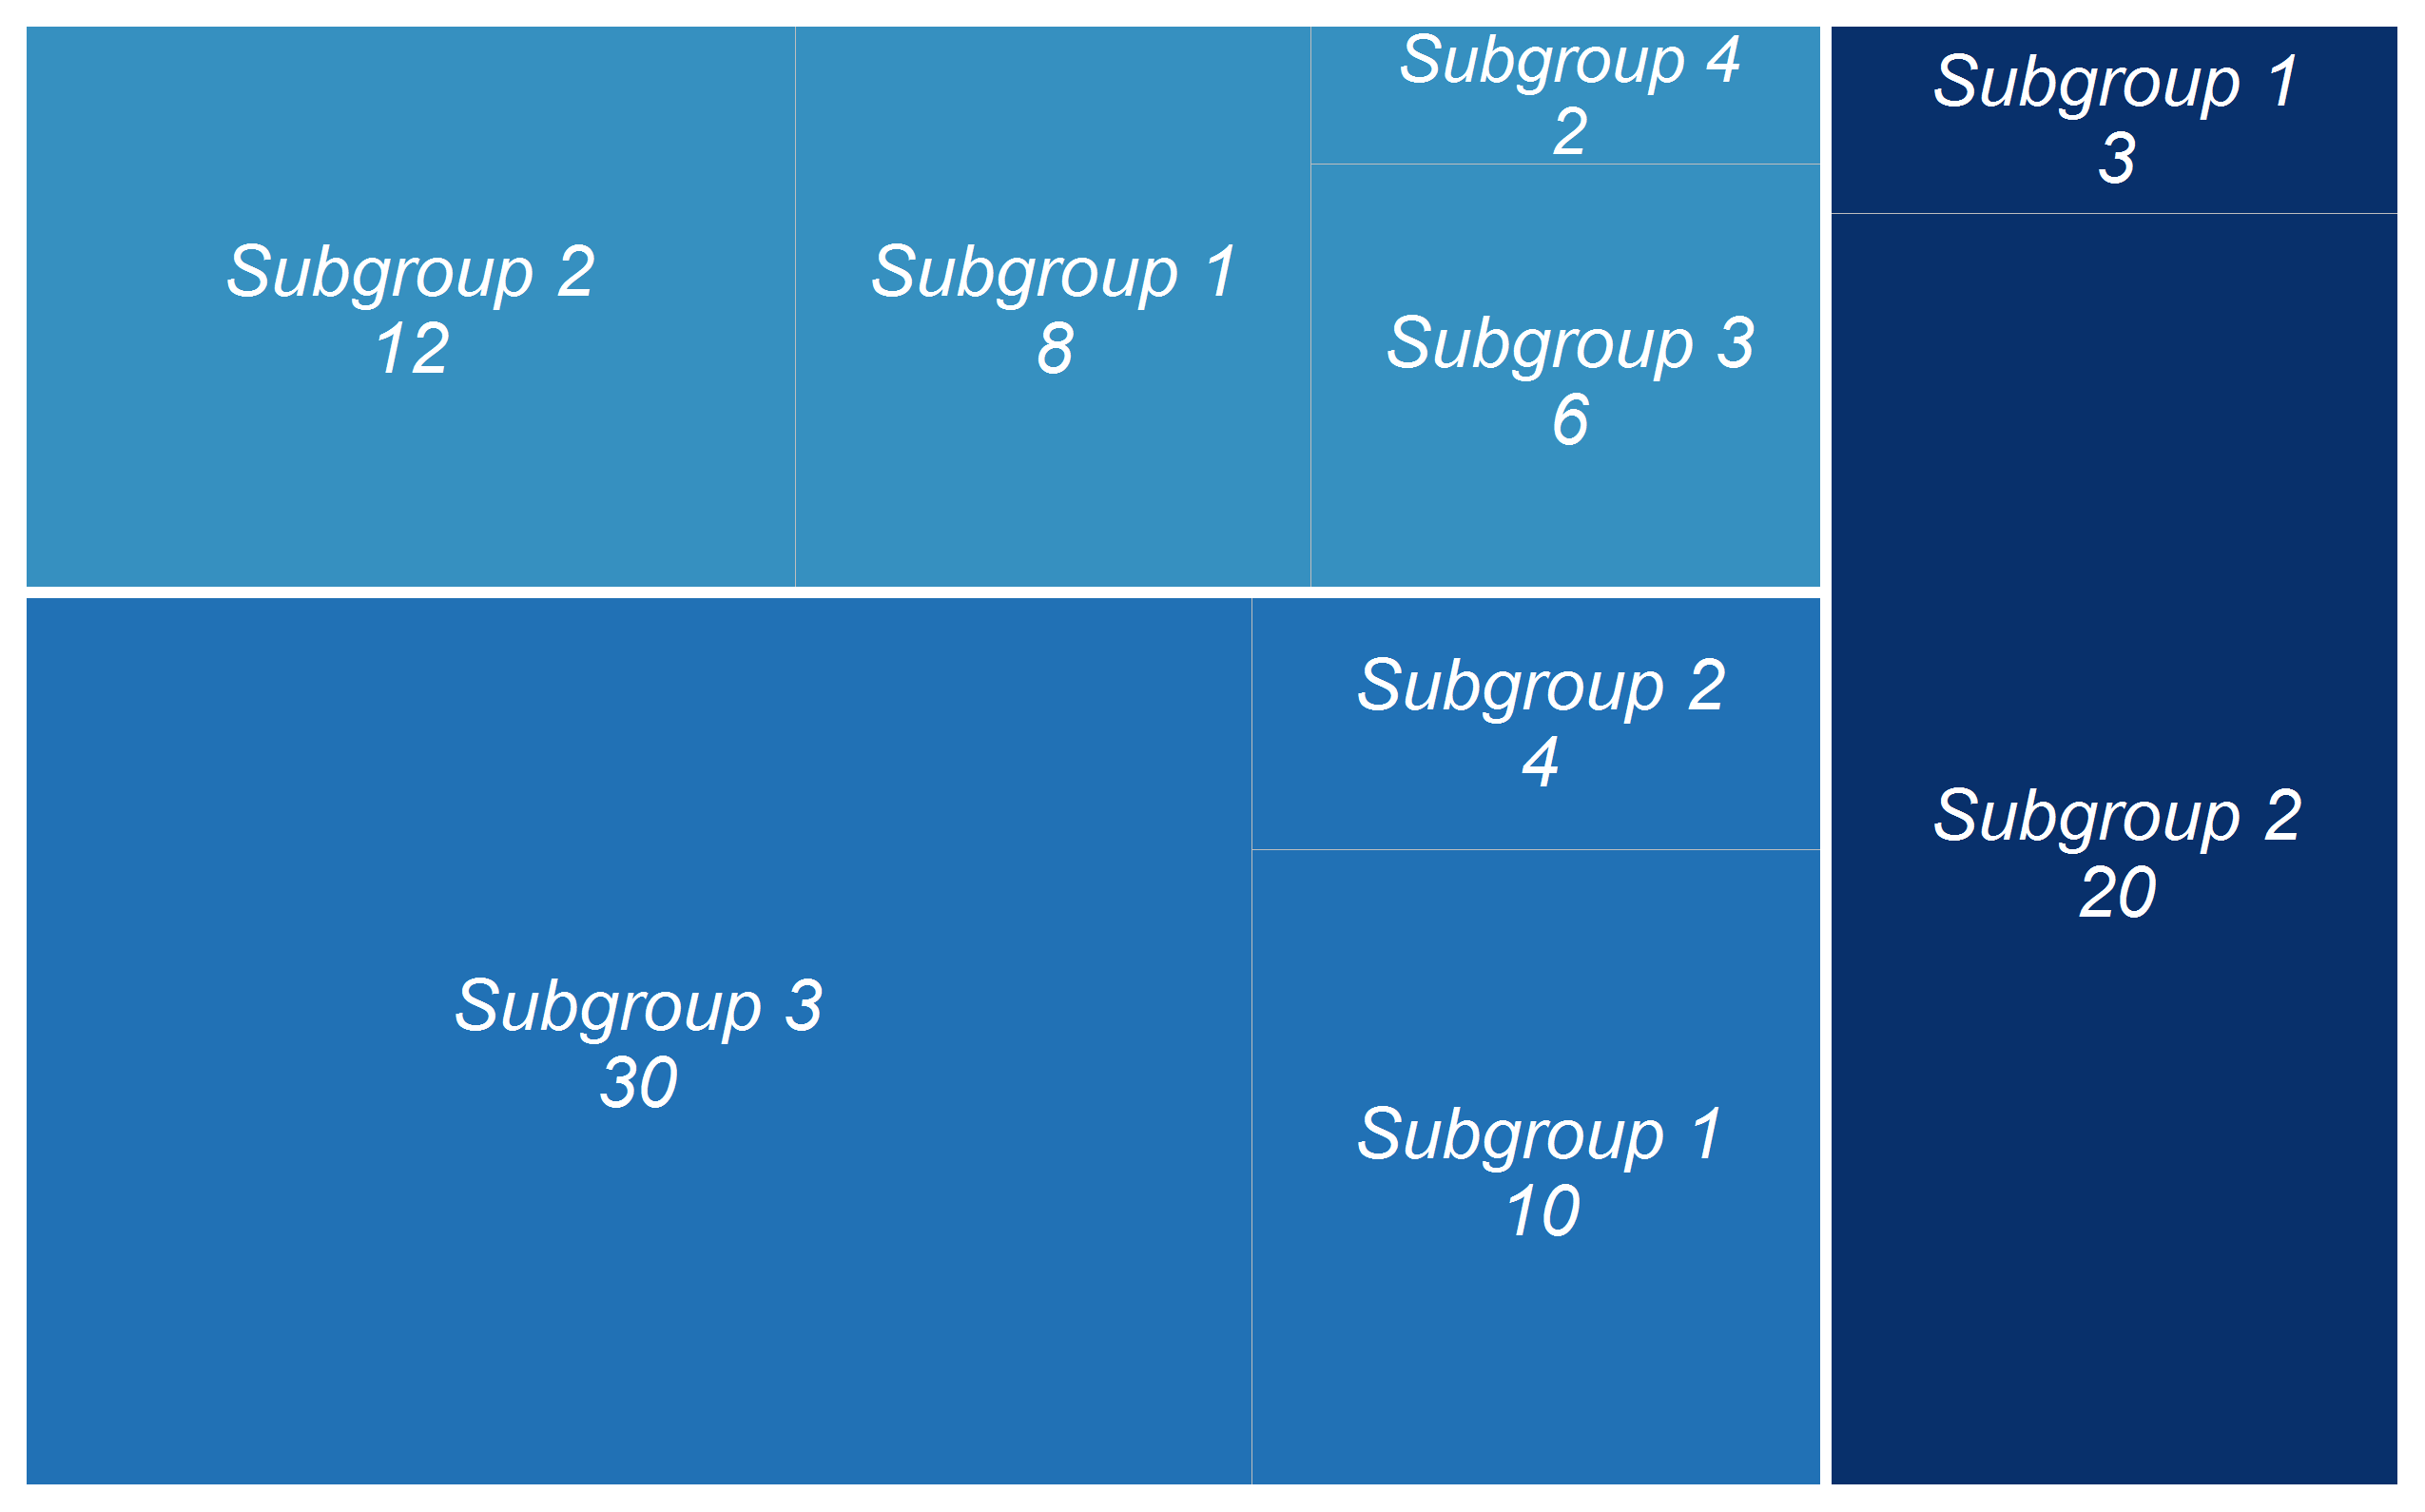
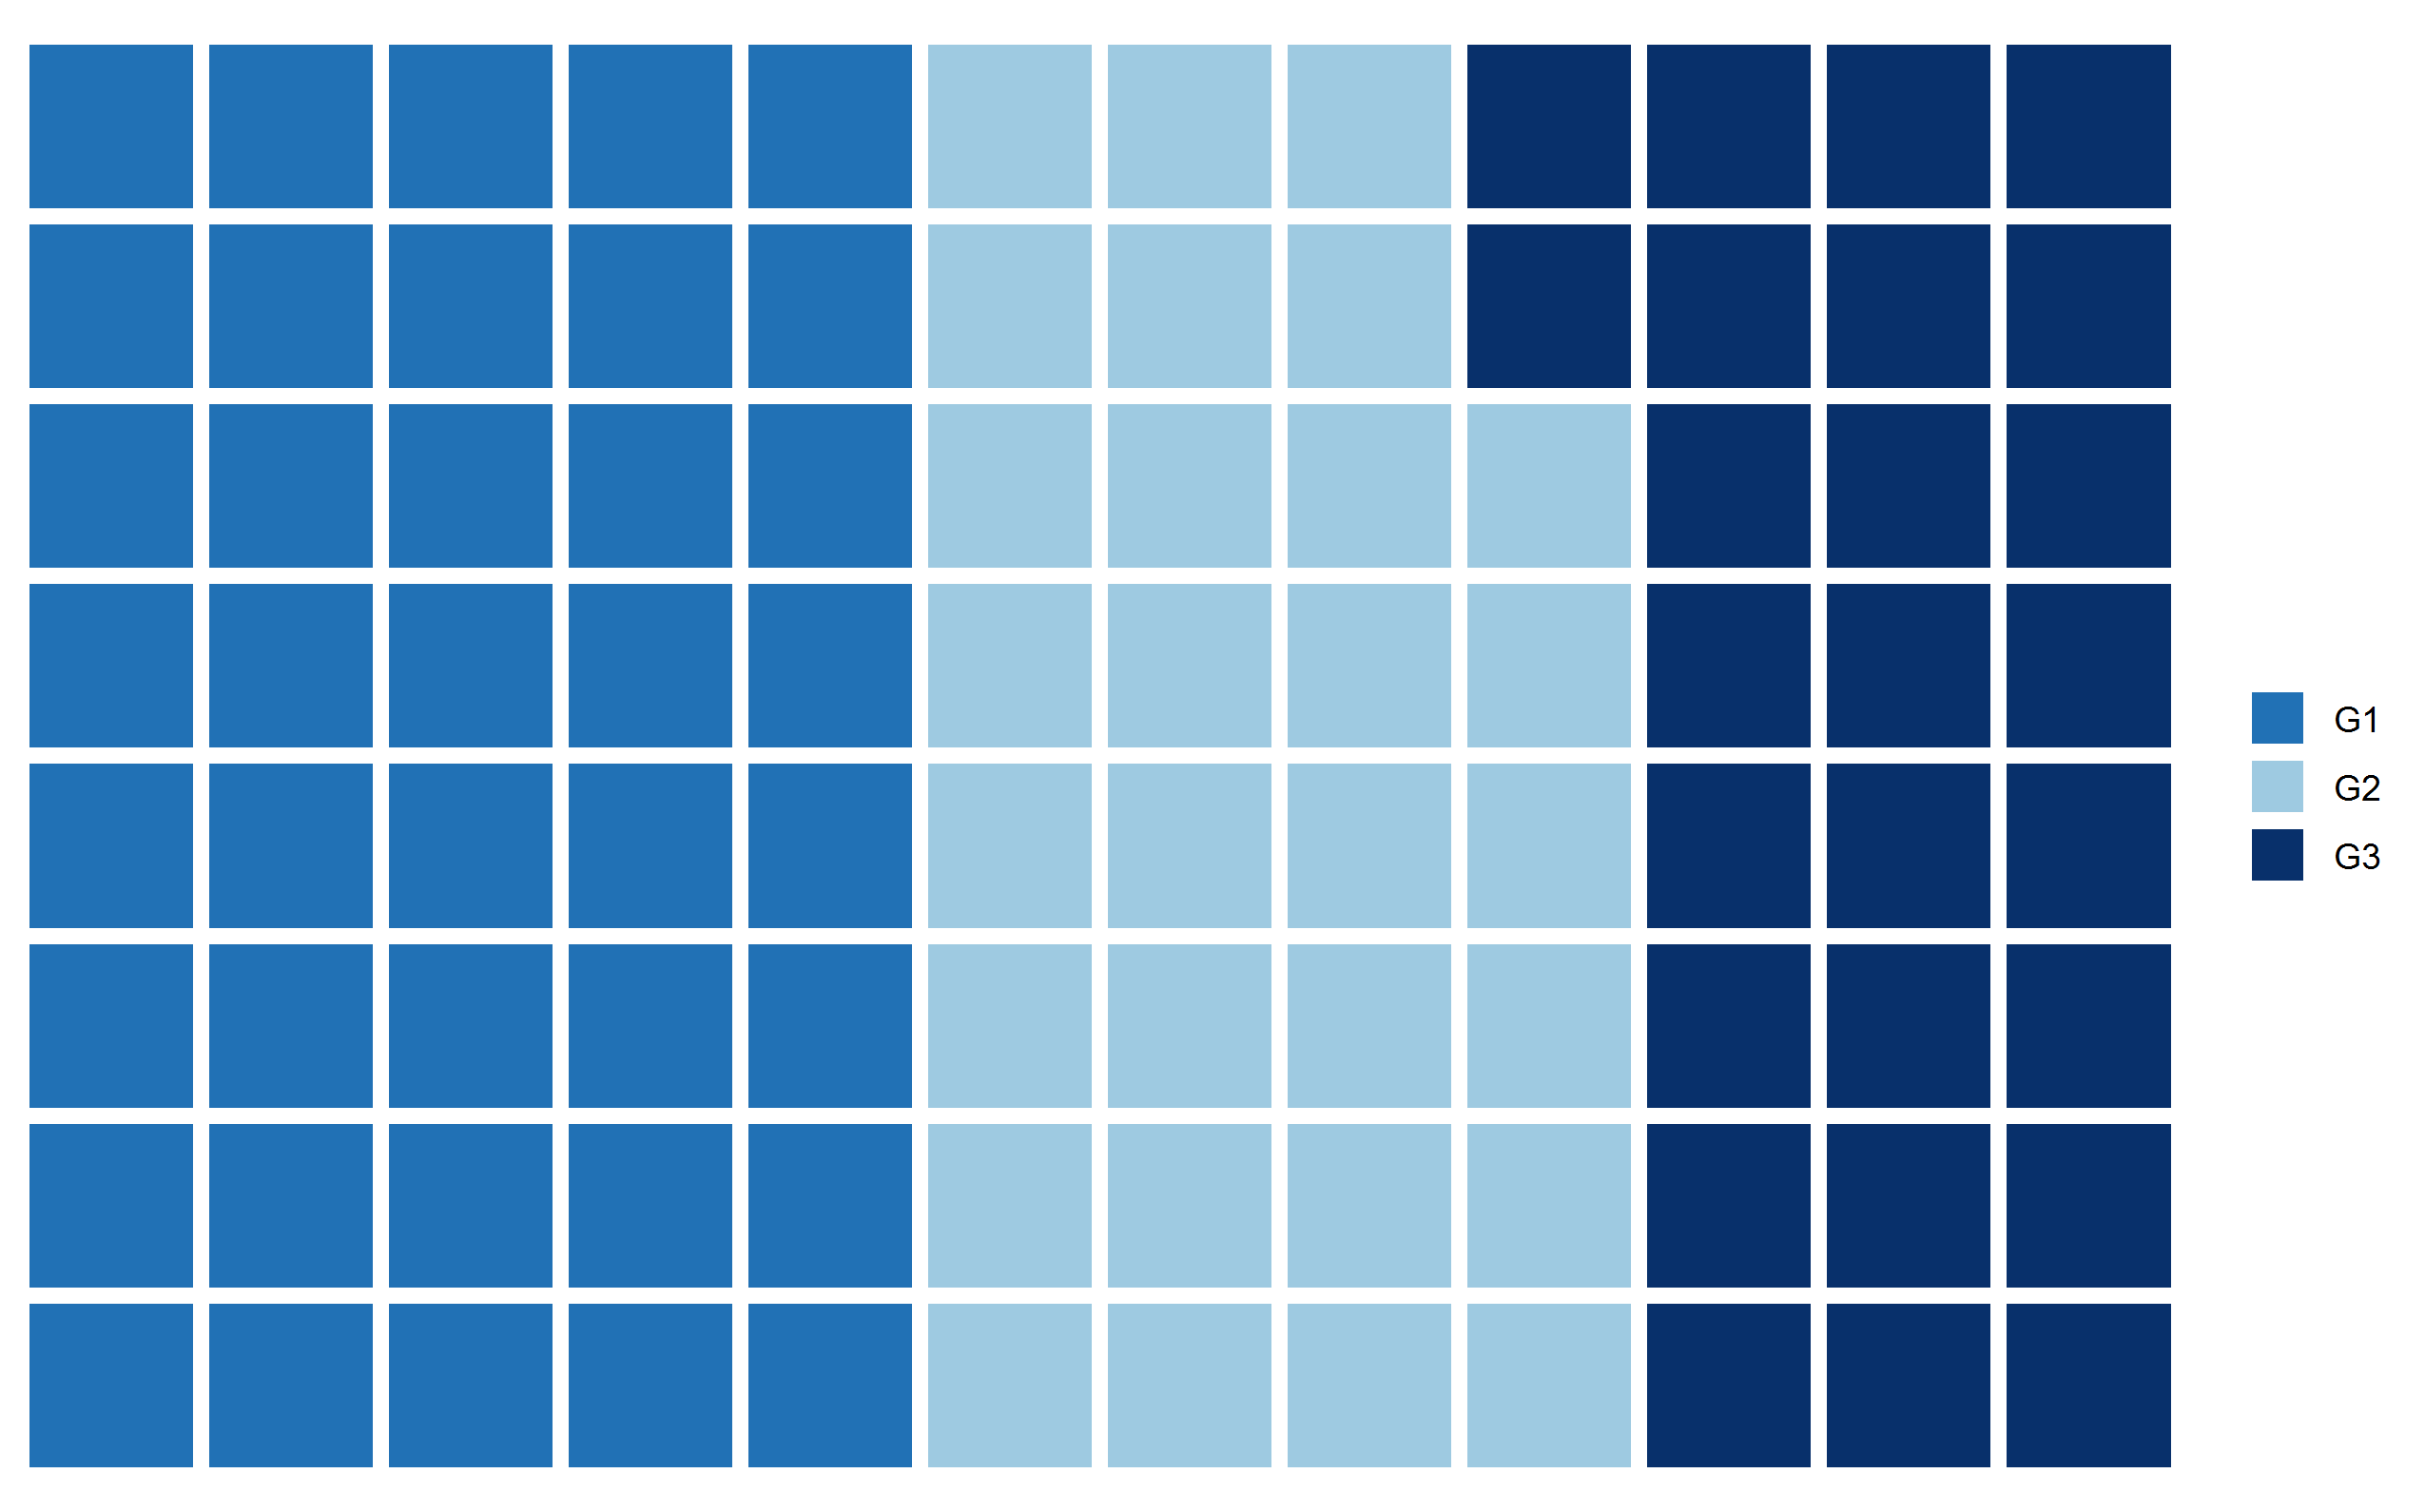
This is a repo that aims to provide a variety of charts with a simple R code to implement them. It is a cheatsheet for selecting the appropriate information for your dataset. Each type of chart comes with a sample dataset to test it first. The output plot is provided as a png file.

Code and Resources Used

R Version: 3.6.3
Packages: ggplot2, dplyr, tidyverse, wordcloud, ggpubr, fmsb, VennDiagram, corrplot, GGally, UpSetR, quantmod, plotly, treemapify, densityridges, circlize

*Click on the chart type to access the repo and on the chart image to access the code

barplot

paretochart

grouped-barplot

stacked-barplot

percent-stacked-barplot

butterflyplot

circular-barplot

circular-barplot

piechart

radarchart

chordplot

venndiagram

upsetdiagram

gaugeplot

wordcloud

contourplot

corrplot

heatmap

treemap

waffle

alluvialplot

scatterplot

pairplot

bubbleplot

lollipopplot

densityplot

distributionplots

stripchart

jitterplot

boxplot

violinplot

candlestick

dumbbellplot

parliamentplot

rankchart

bumpchart