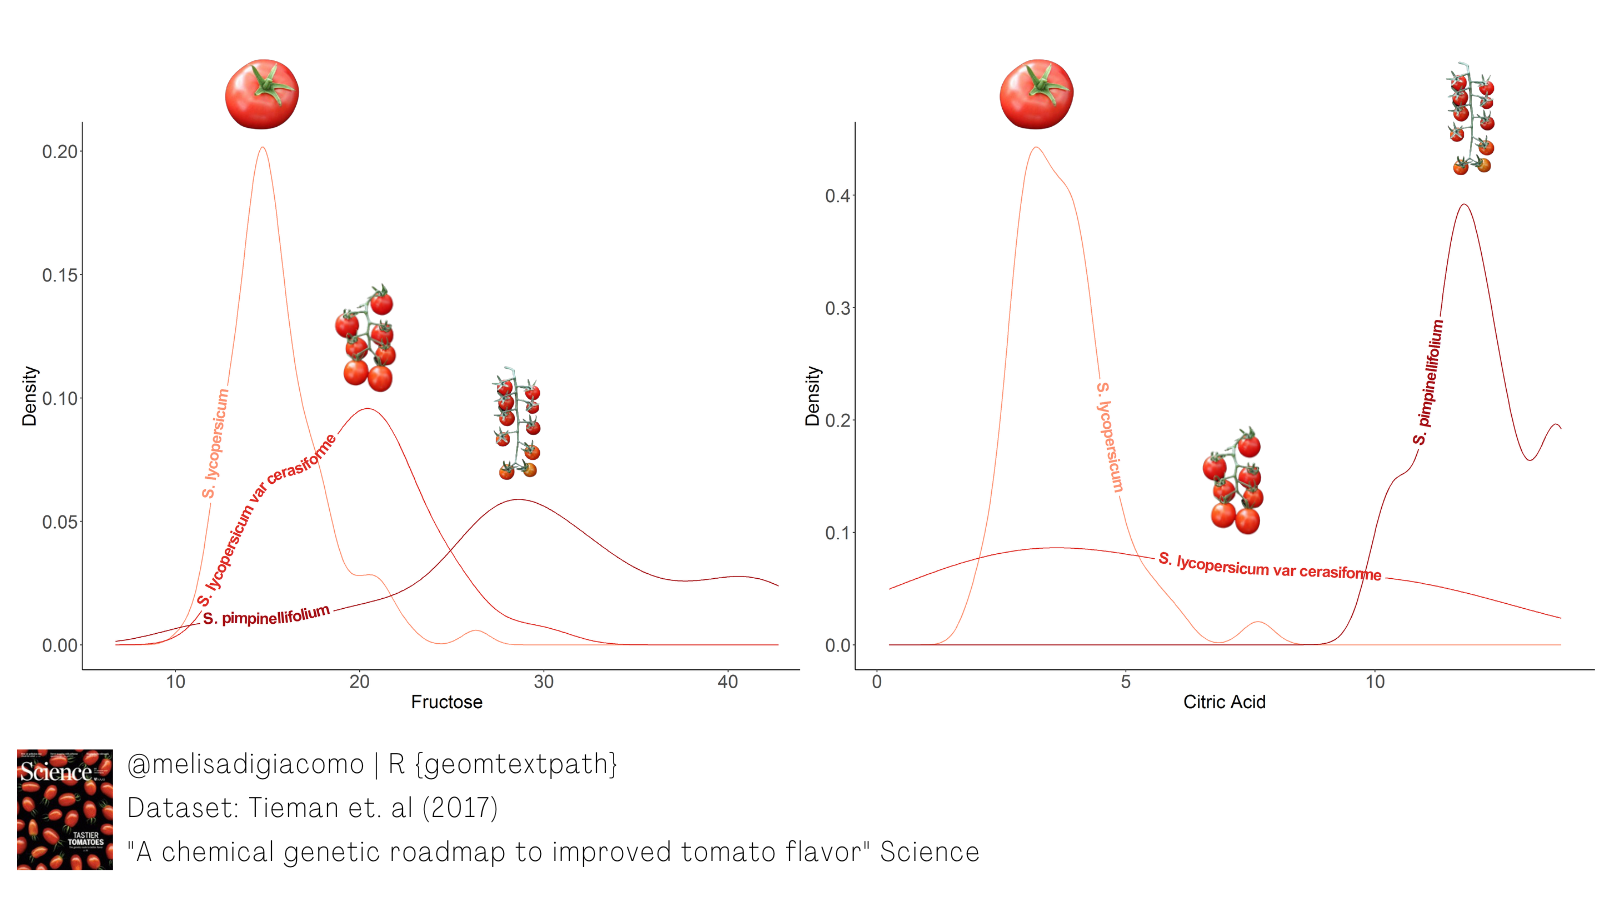
The R package {geomtextpath}, a ggplot2 extension, offers direct and automatic solutions for labeling.
Easy and pretty text labels!
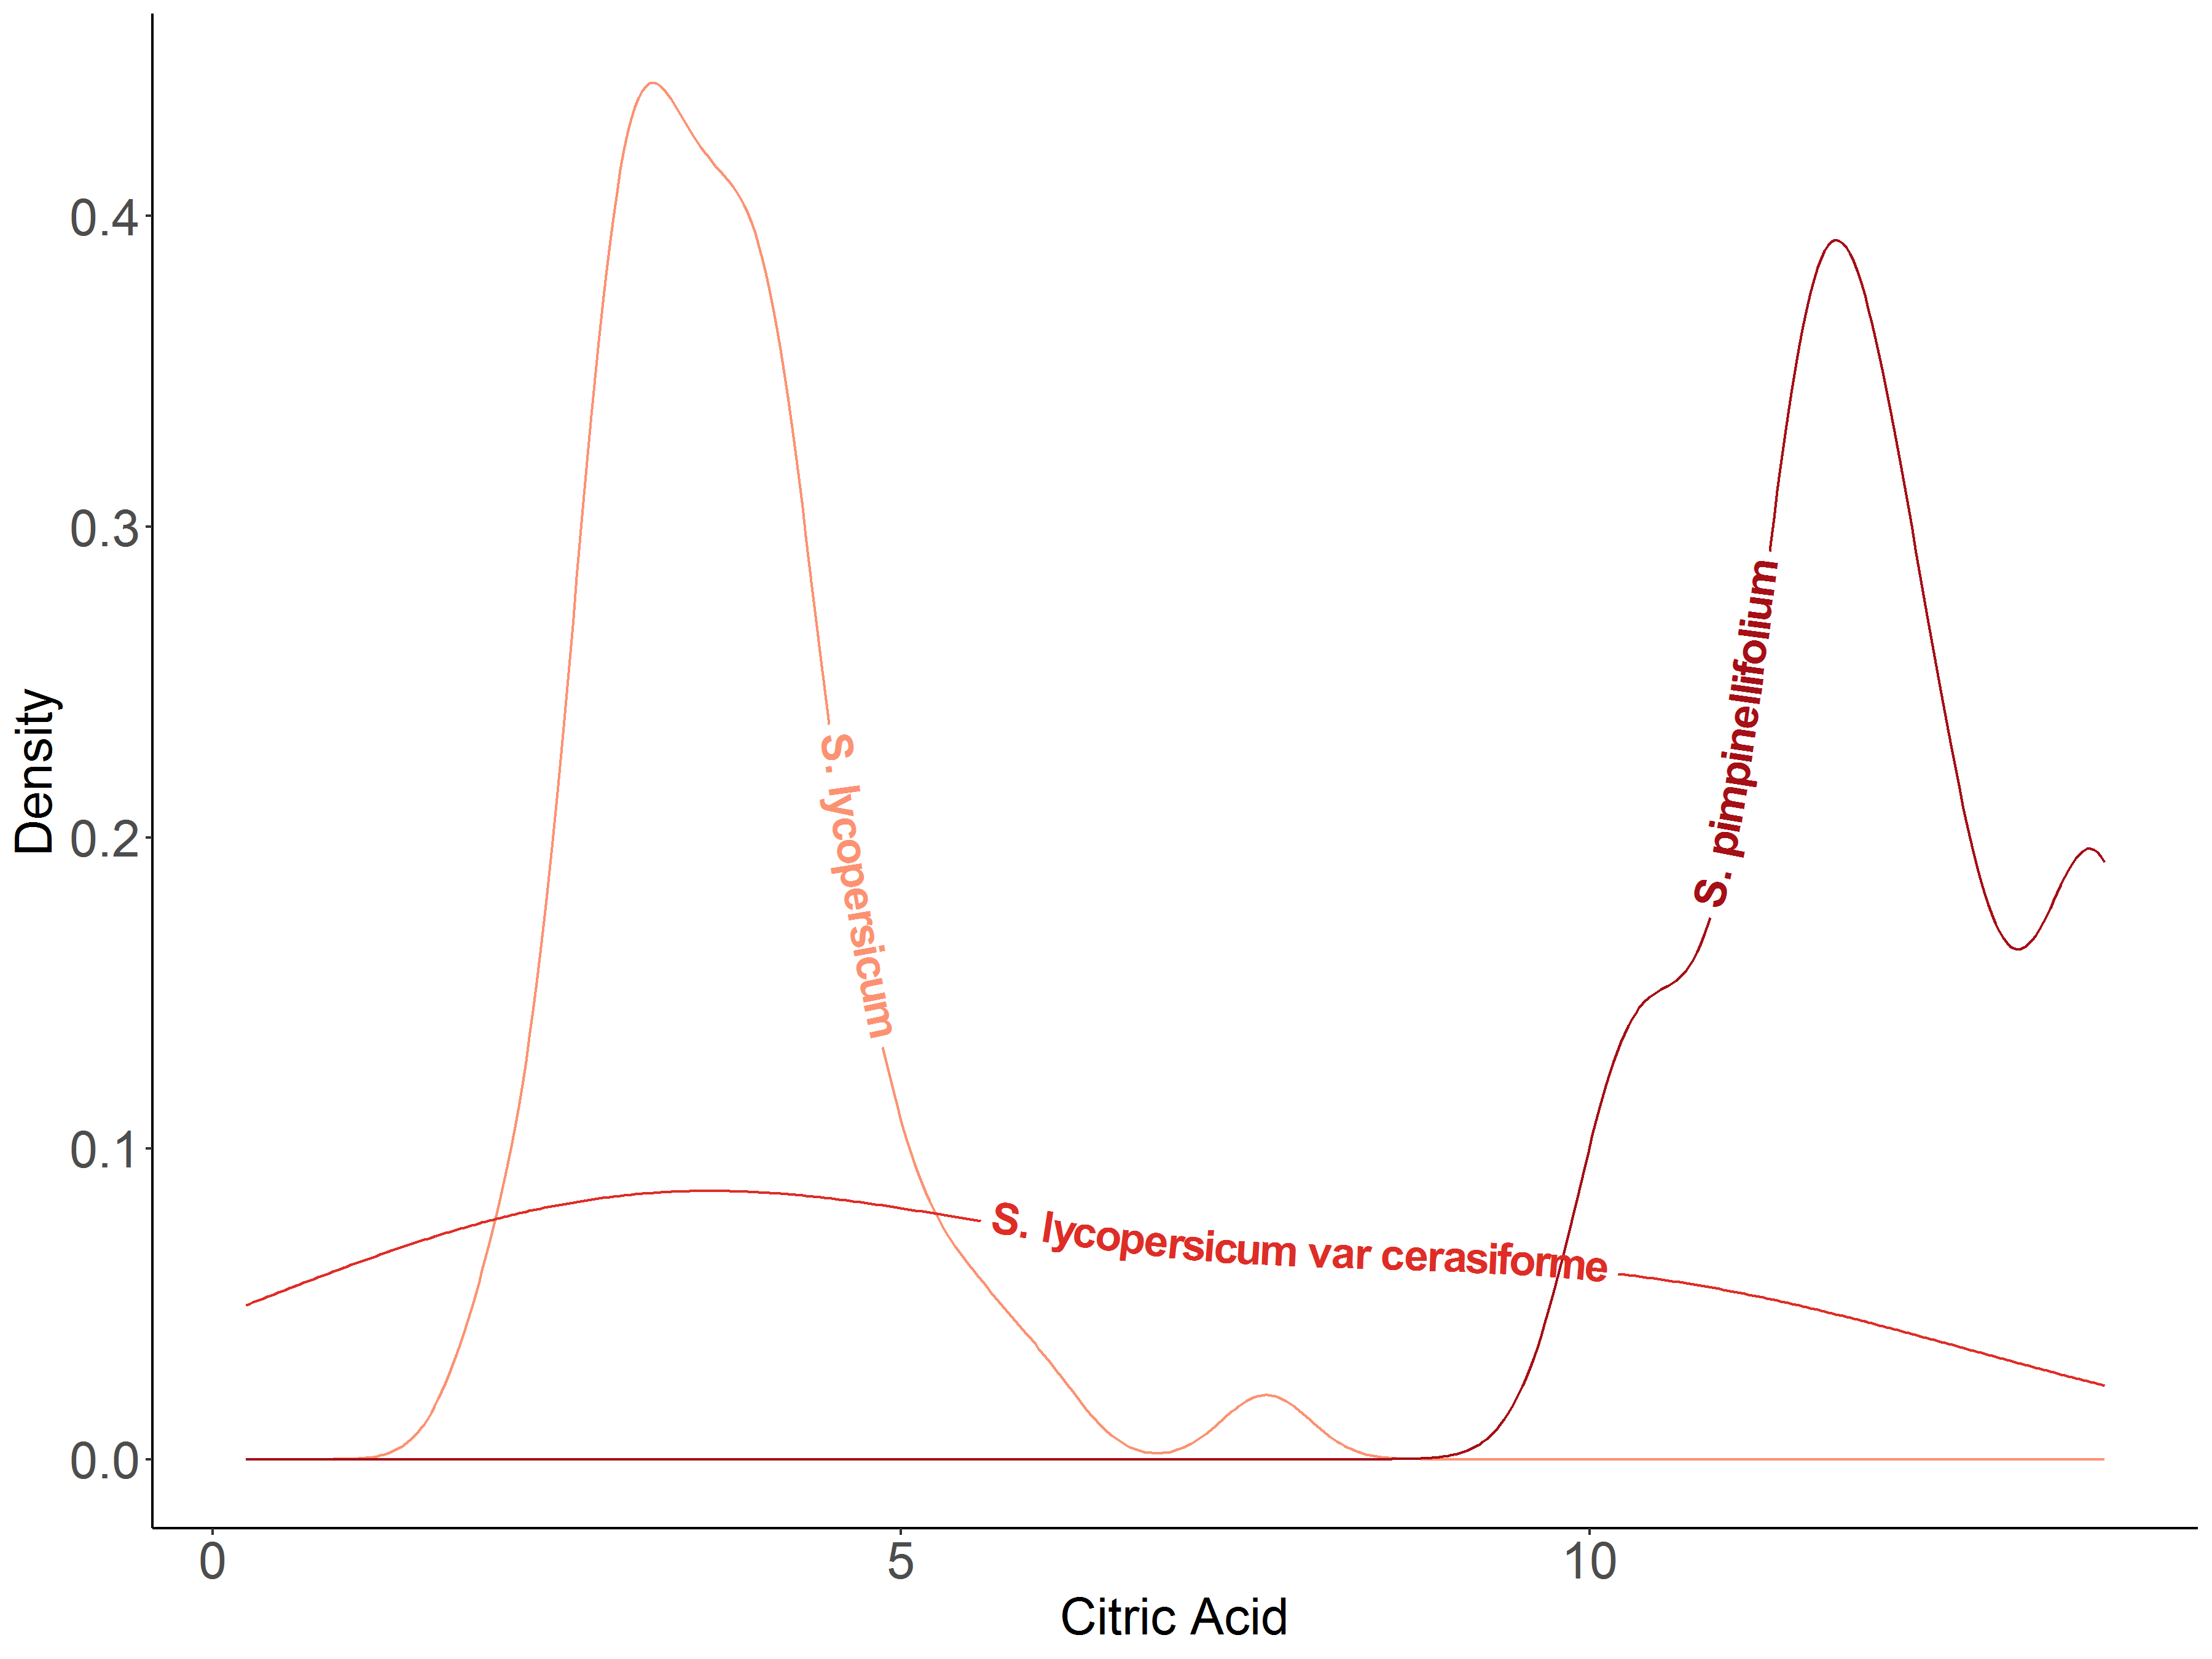
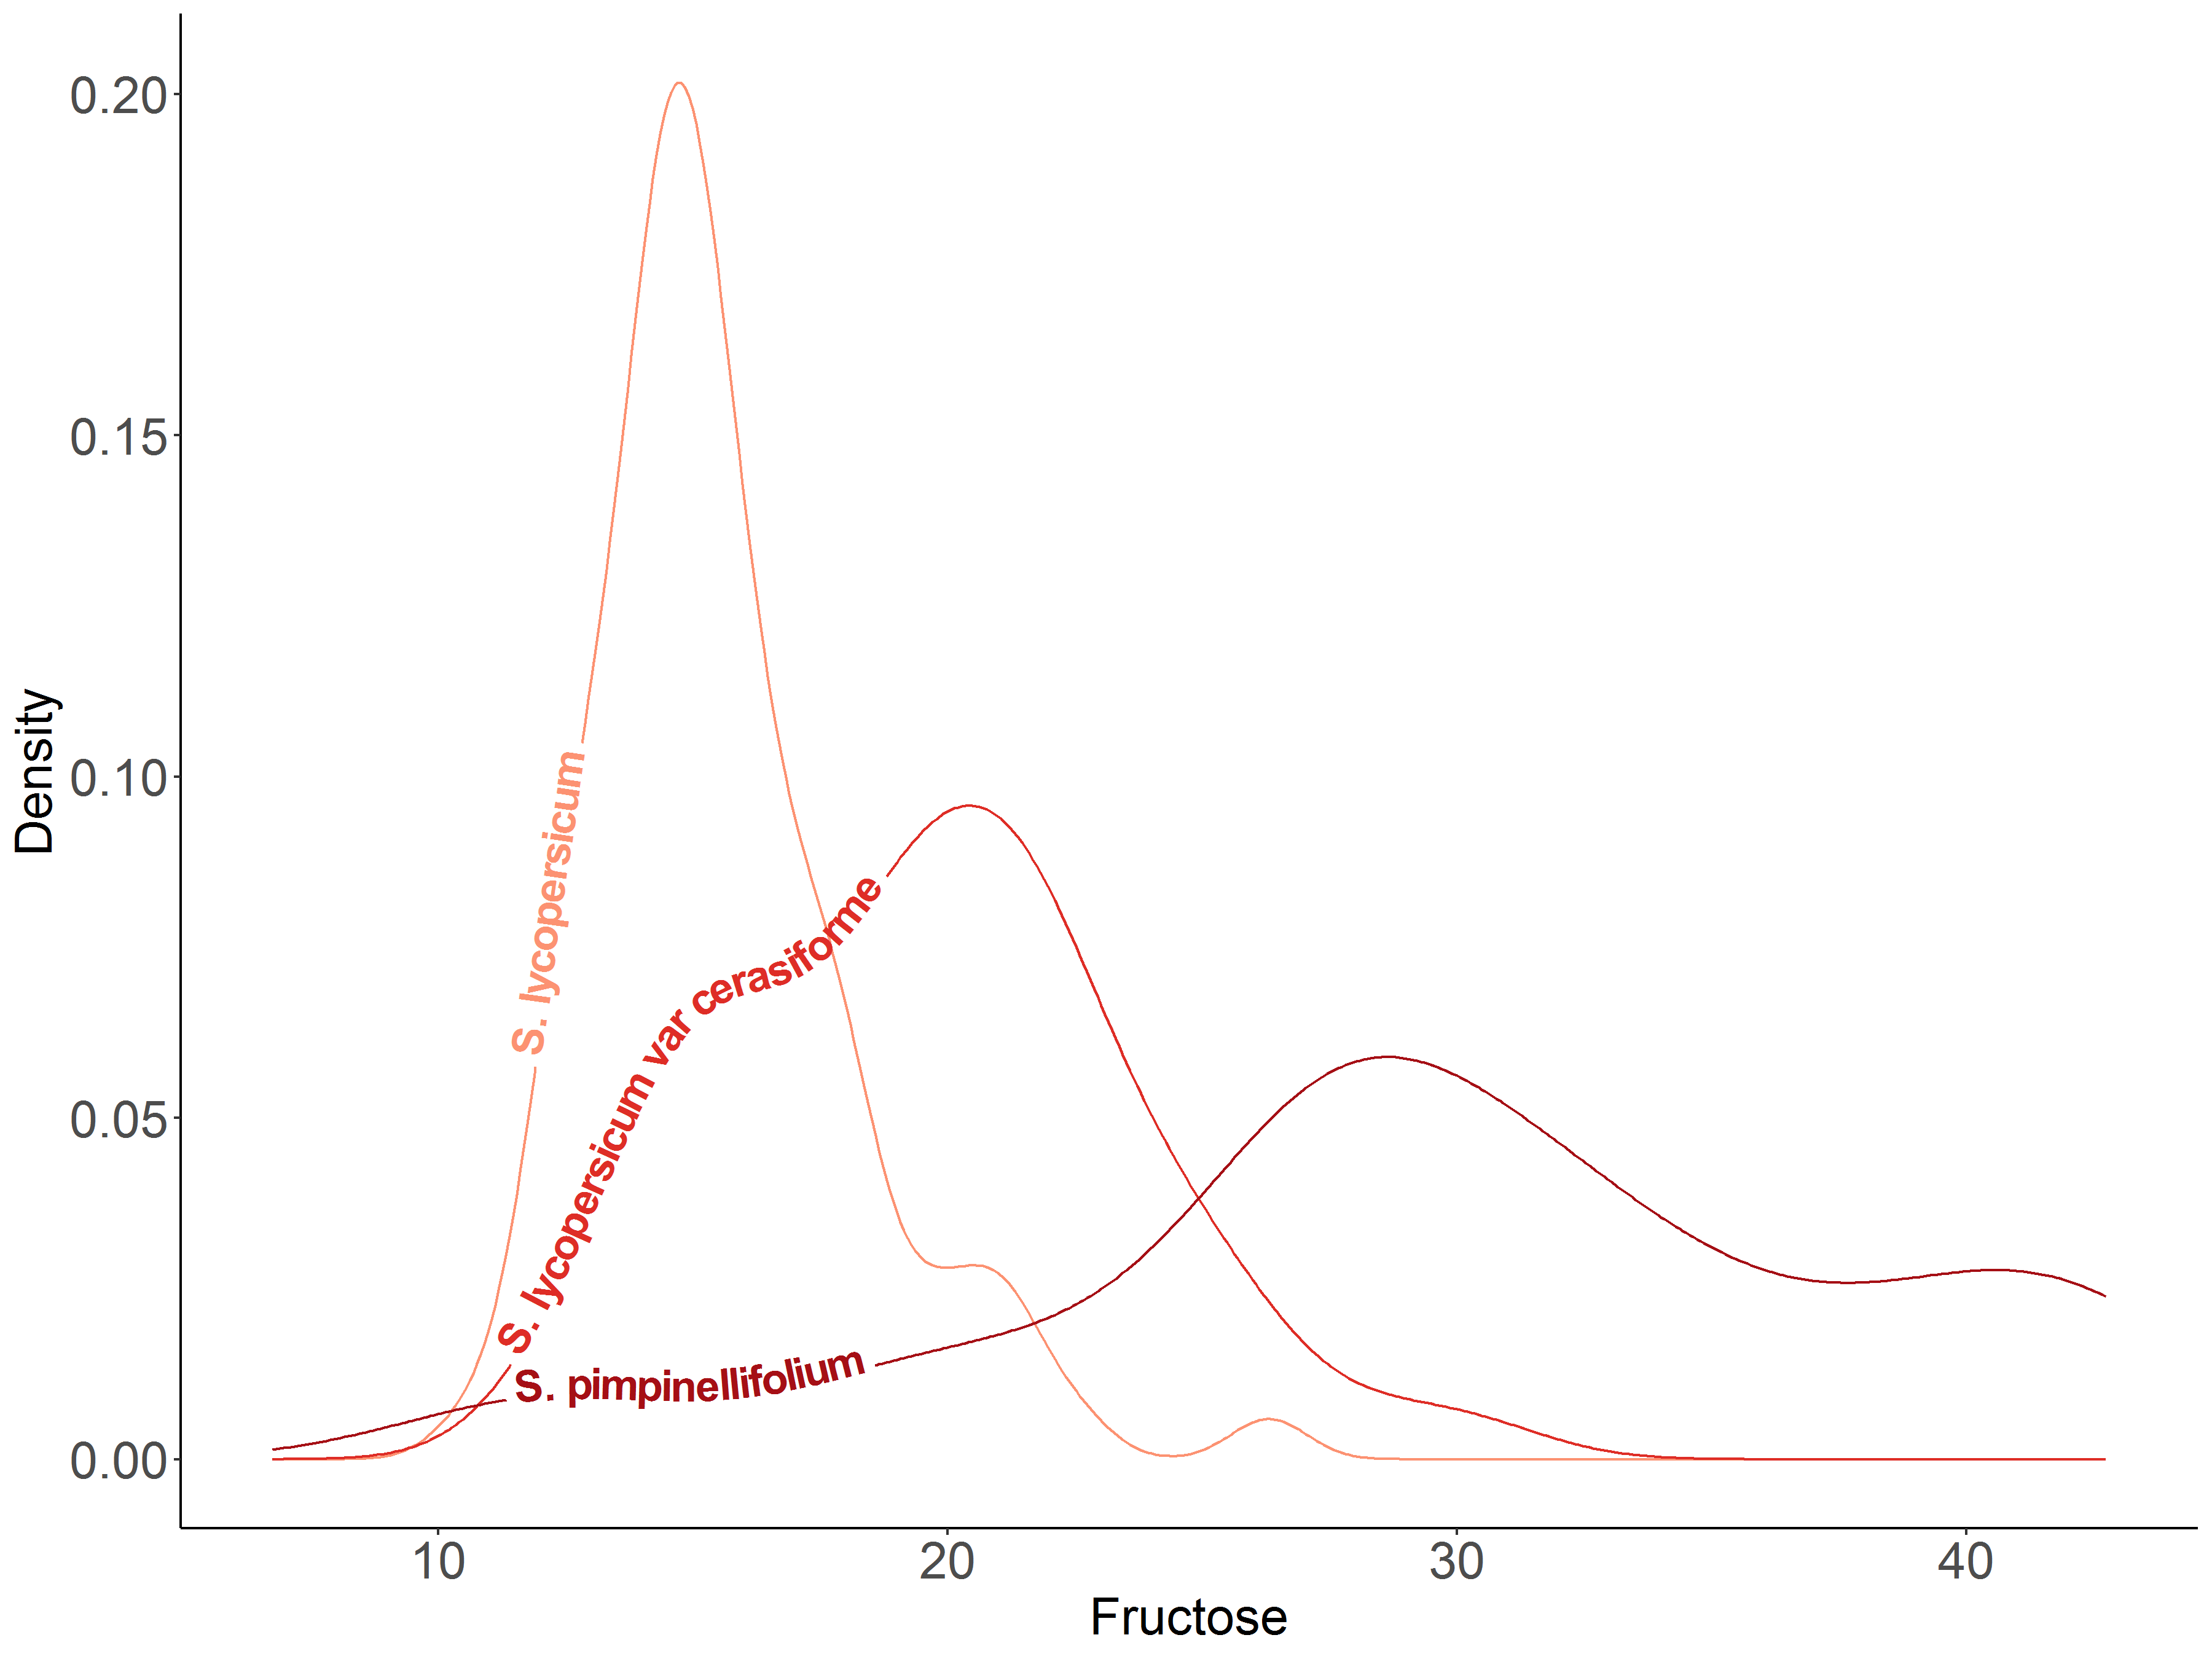
I used it to show density plots of two metabolites (fructose and citric acid) that potentially contribute to flavor in three tomato botanical varieties.
Source: Table S1, Tieman et al. (2017)
# Density plot with automatic labels

# Libraries
library(ggplot2)
library(geomtextpath)

# Dataset
tomato = read.csv('tomato.csv', header=1)
# Citric acid by botanical variety
ggplot(tomato, aes(x = citric_acid, colour = botanical_variety, label = botanical_variety)) +
geom_textdensity(size = 6, fontface = 2, hjust = 0.2, vjust = 0.33) +
labs(title="Citric acid content by tomato botanical varieties",
caption="Source: Table S1, Tieman et al. 2017\n@melisadigiacomo") +
xlab("Citric Acid") + ylab("Density") +
scale_colour_manual(values = c("#fc9272", "#de2d26", "#a50f15")) +
theme_classic() + theme(legend.position = "none", axis.text = element_text(size = 15), text = element_text(size = 15)) # Fructose by botanical variety
ggplot(tomato, aes(x = fructose, colour = botanical_variety, label = botanical_variety)) +
geom_textdensity(size = 6, fontface = 2, hjust = 0.15, vjust = 0.2) +
labs(title="Fructose content by tomato botanical varieties",
caption="Source: Table S1, Tieman et al. 2017\n@melisadigiacomo") +
xlab("Fructose") + ylab("Density") +
scale_colour_manual(values = c("#fc9272", "#de2d26", "#a50f15")) +
theme_classic() + theme(legend.position = "none", axis.text = element_text(size = 15), text = element_text(size = 15))

