This is an R package for making plasmid maps using {ggplot2}.
This repo is forked from bradyajohnston/plasmapr and edited to visualise AMR genes on plasmids. It is my first time releasing a package so is experimental and only involves a few small tweeks. It still needs more work.
This package is still very early in development and the API may change. The parser for
.gbfiles works most of the time but has not been tested extensively.
For the original package:
# install.packages("devtools")
devtools::install_github("bradyajohnston/plasmapr")
For the new AMR gene package:
# install.packages("devtools")
devtools::install_github("melparker101/plasmapamr", ref = "ctx-m_plasmids")
Conda package in progress...
The code below is for the original package:
plasmapR provides functions for parsing and plotting .gb plasmid
files.
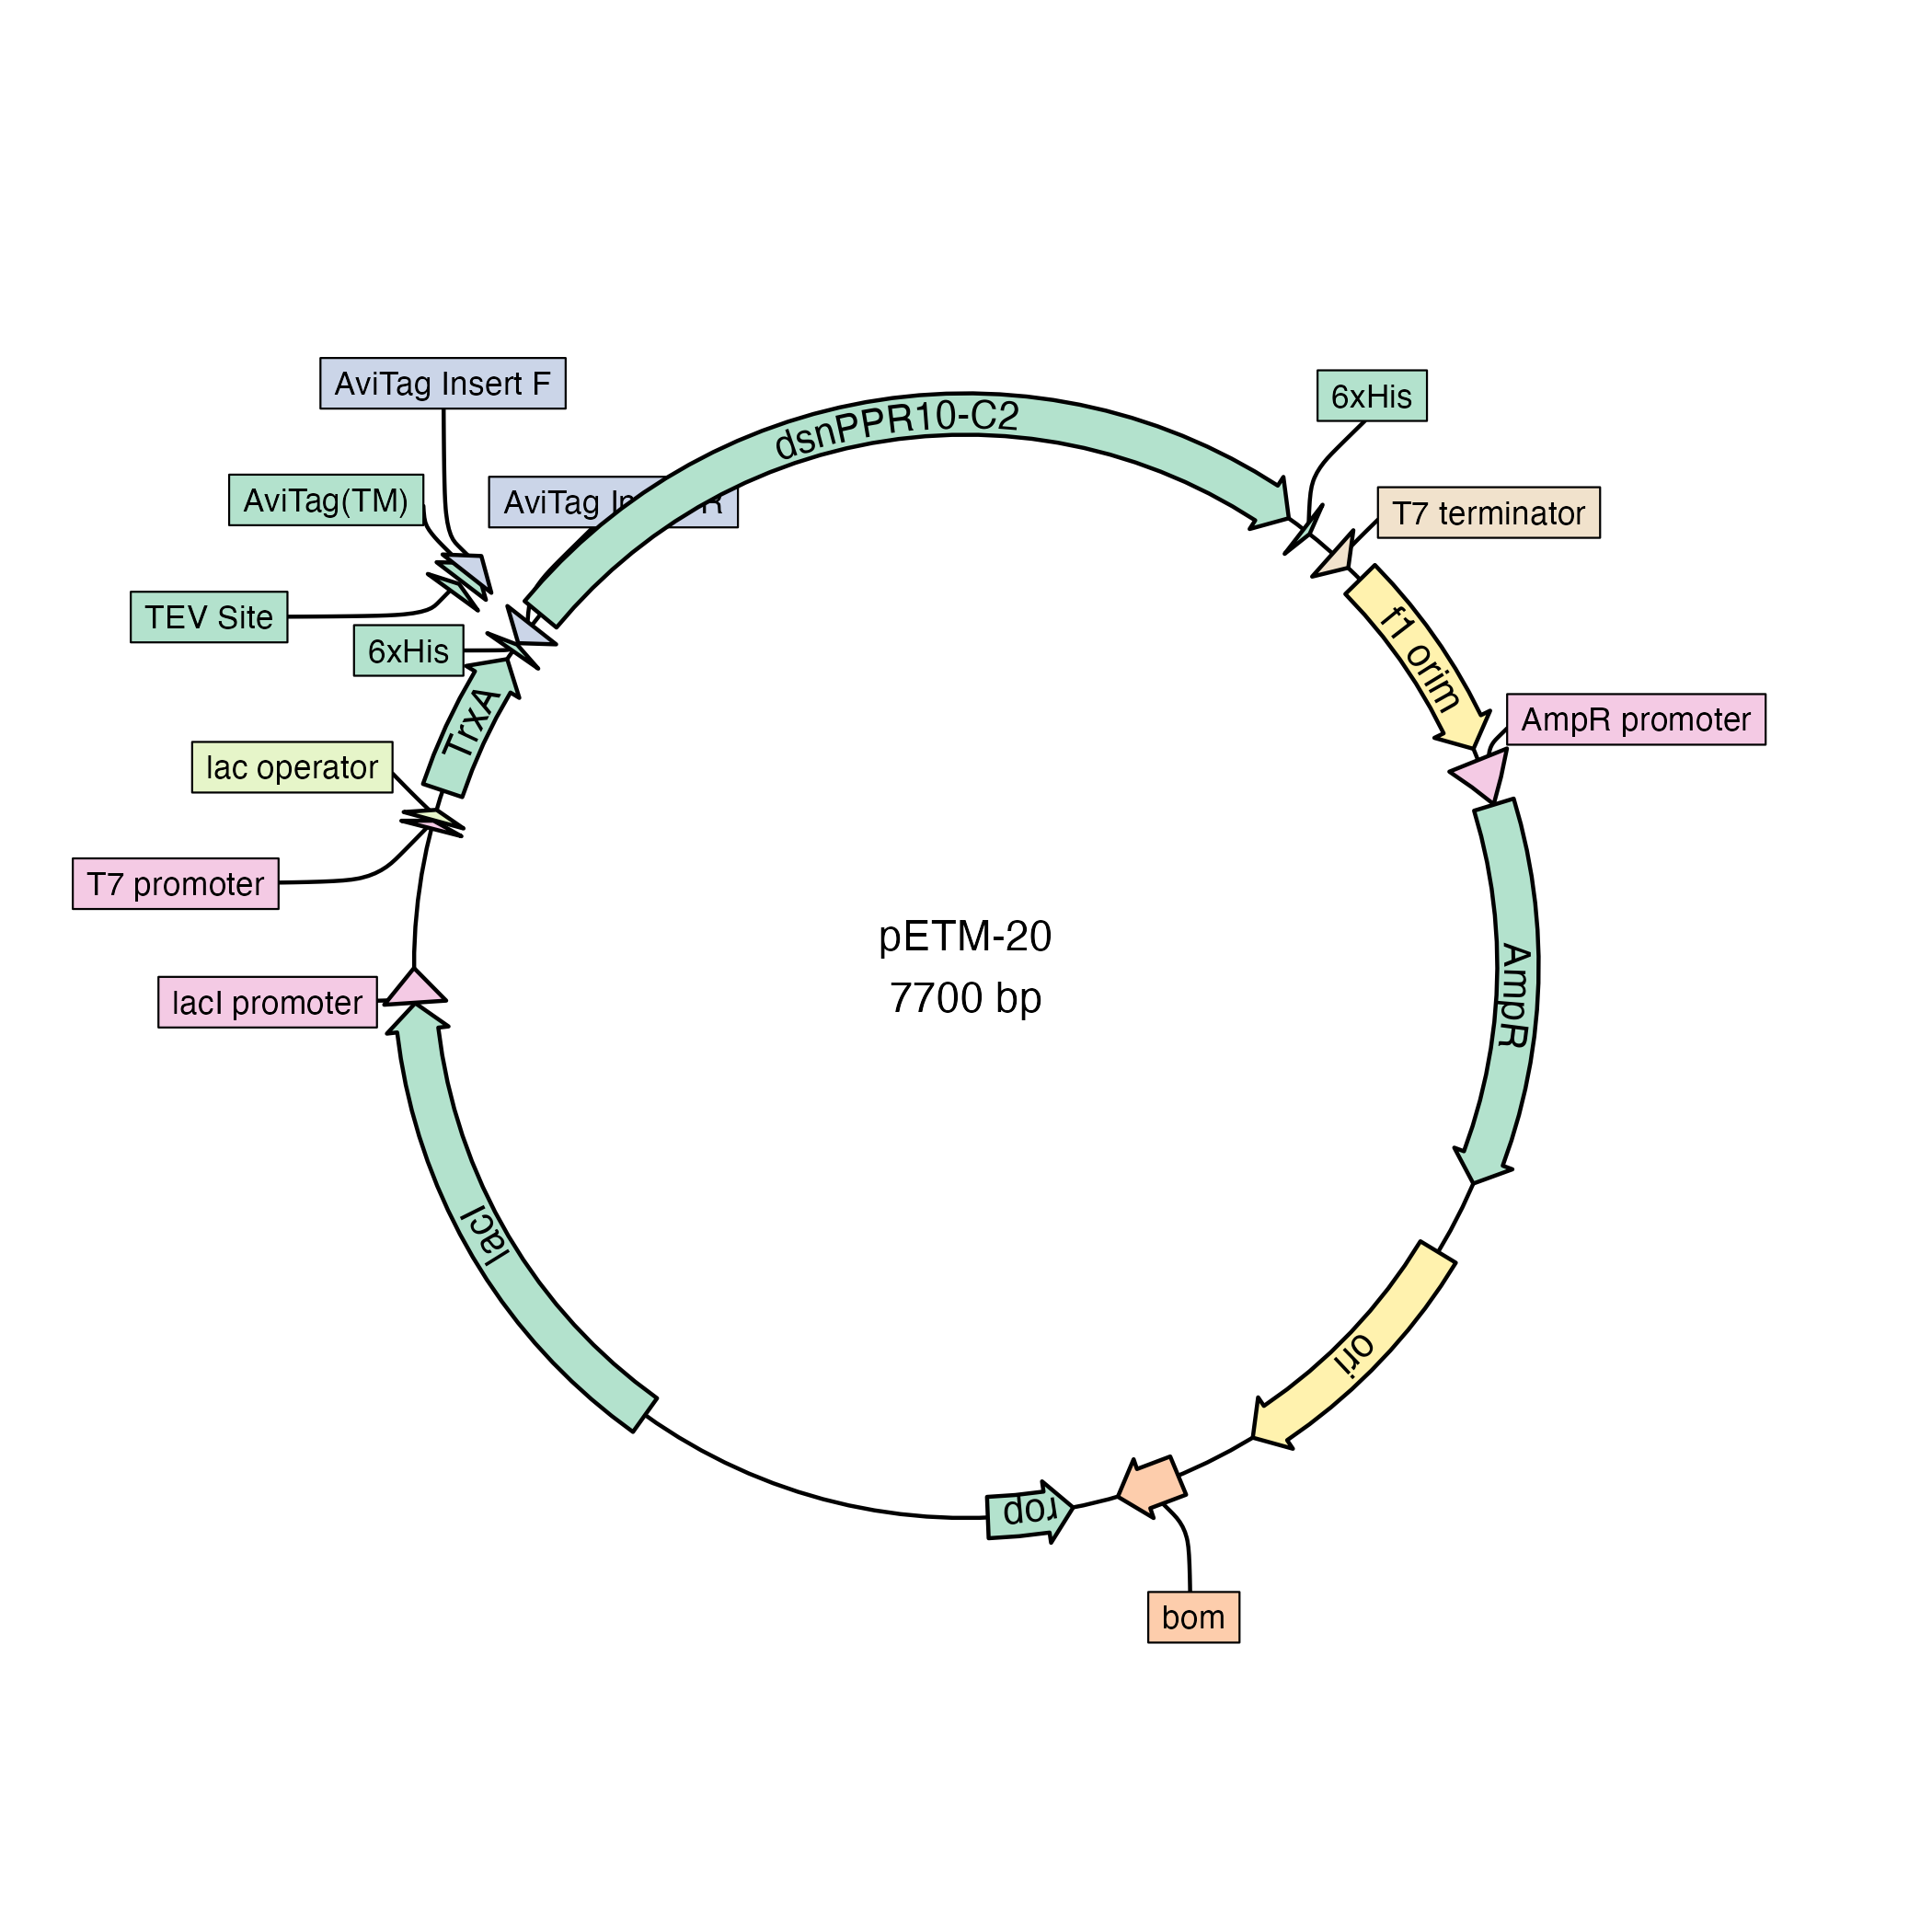
Once a plasmid has been exported in Genbank format it can be parsed and plotted.
library(plasmapR)

fl <- system.file('extdata', 'petm20.gb', package = "plasmapR")

fl |>
  read_gb() |>
  plot_plasmid(name = "pETM-20")
Access the features by turning the plasmid into a data.frame.
fl <- system.file('extdata', 'petm20.gb', package = "plasmapR")

plasmid <- fl |>
  read_gb()

dat <- plasmid |>
  as.data.frame()

head(dat)
## index name type start end direction
## 1 1 synthetic DNA construct source 1 7700 1
## 2 2 f1 orim rep_origin 12 467 1
## 3 3 AmpR promoter promoter 494 598 1
## 4 4 AmpR CDS 599 1459 1
## 5 5 ori rep_origin 1630 2218 1
## 6 6 bom misc_feature 2404 2546 1
dat[dat$type == "CDS", ] |>
  plot_plasmid(name = "pETM-20")
It’s not currently intended for linear display, but it can be used as
such. I recommend checking out the
gggenese package.
dat[dat$type == "CDS", ] |>
  plot_plasmid(name = NULL) +
  ggplot2::coord_cartesian() +
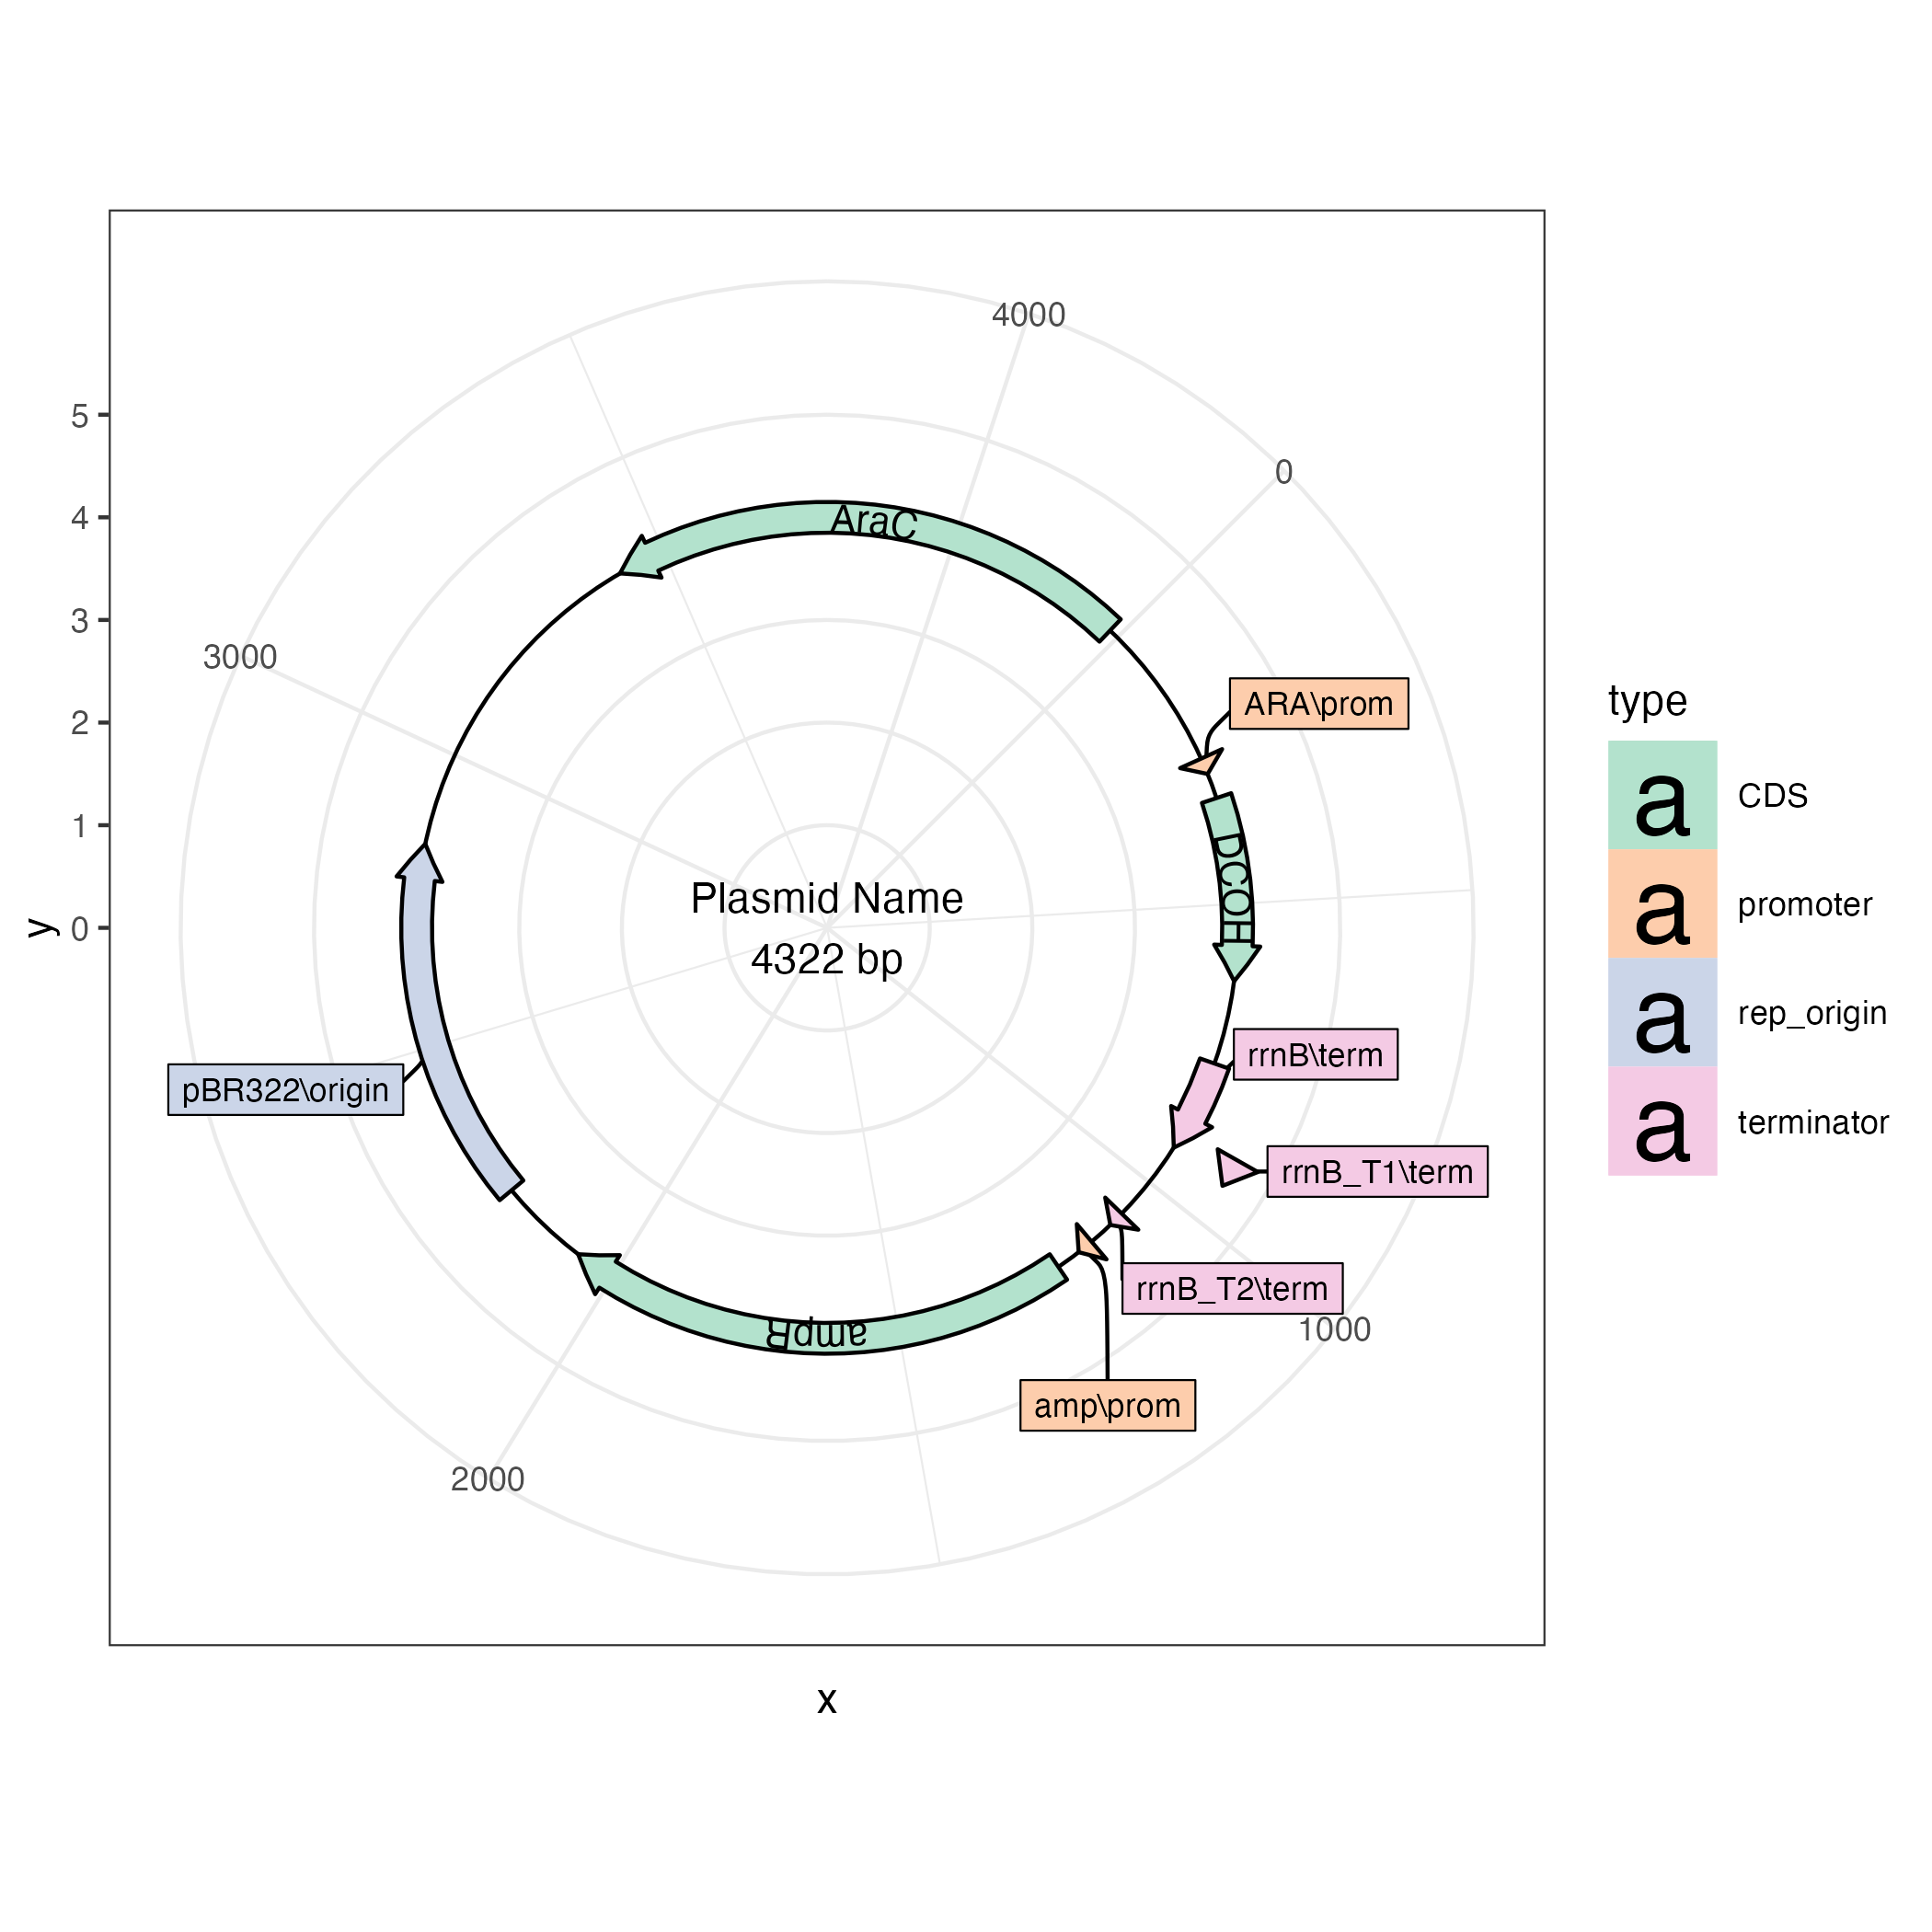
ggplot2::scale_y_continuous(limits = NULL)The result of the call is just a {ggplot2} plot, which you can further customise to your liking with themes, etc.
fl <- system.file('extdata', '20.gb', package = "plasmapR")

plt <- fl |>
  read_gb() |>
  plot_plasmid()

plt + ggplot2::theme_bw()


