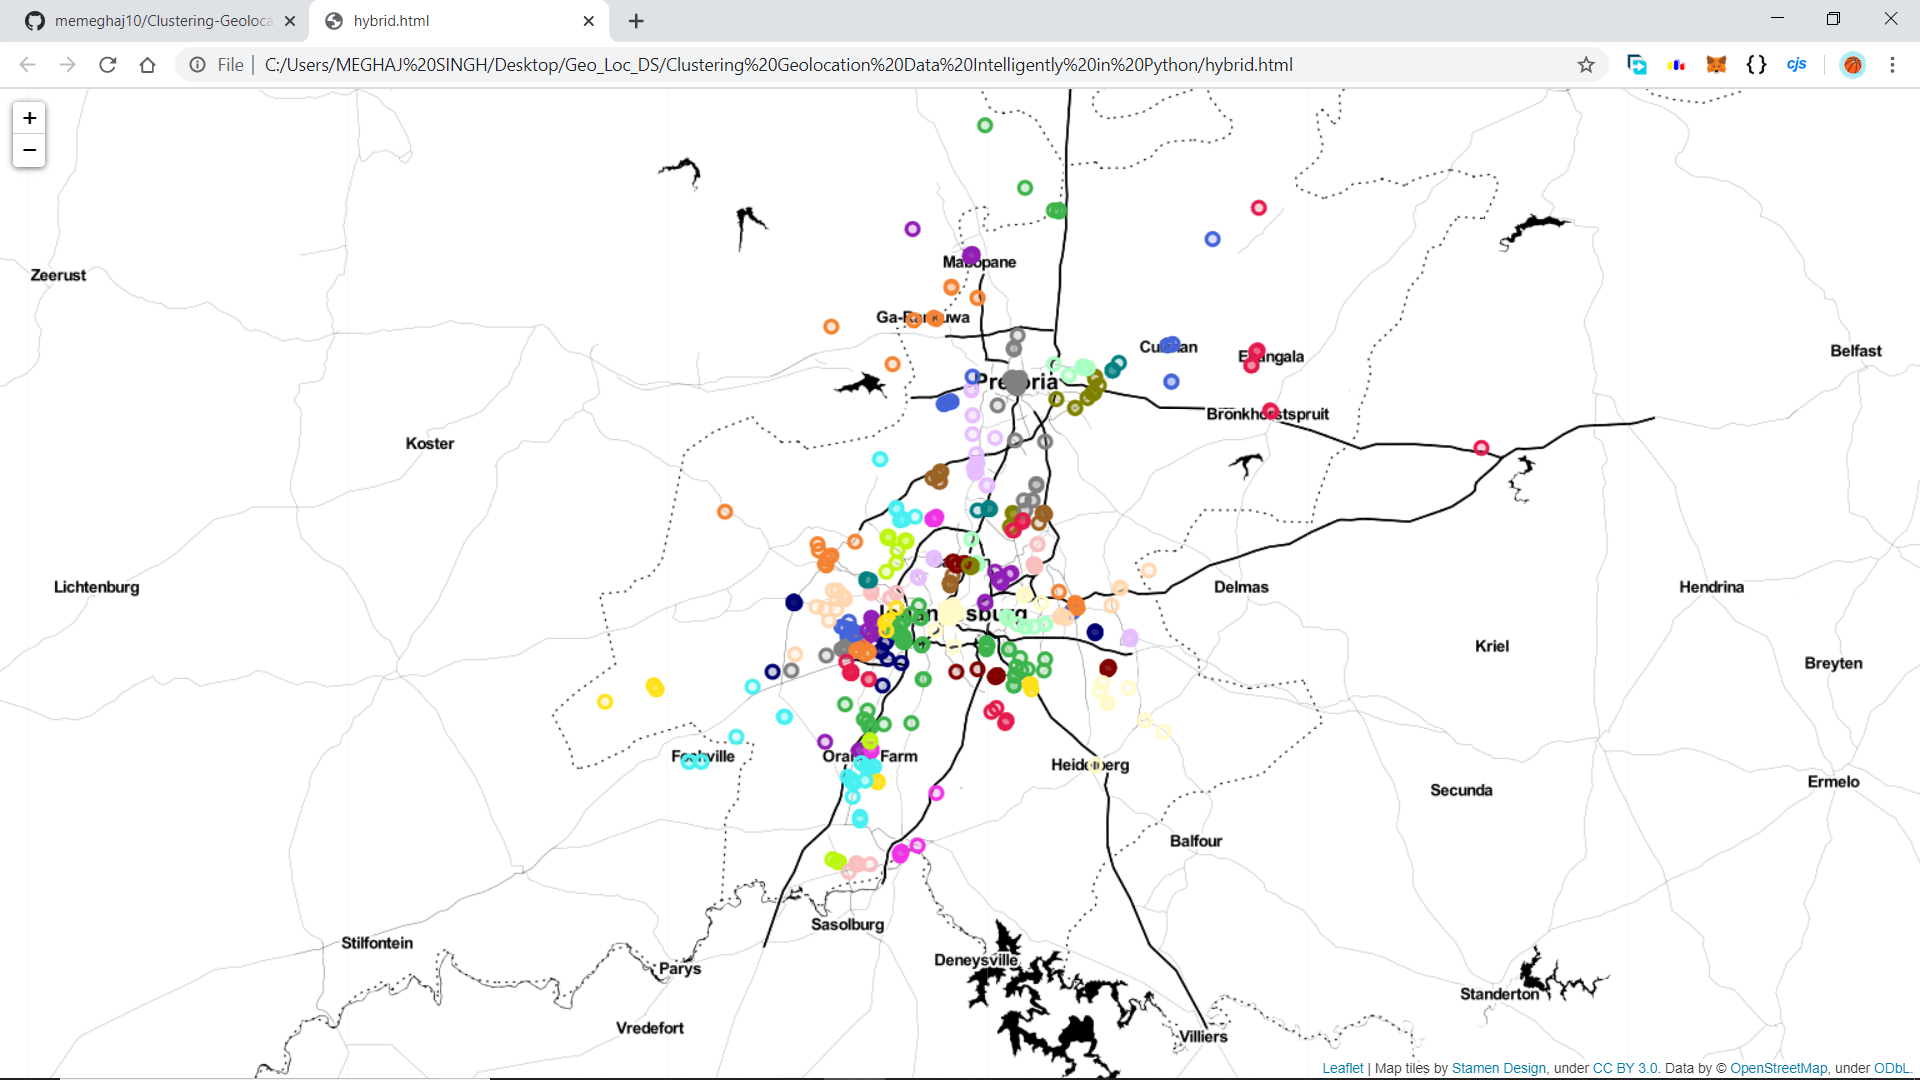
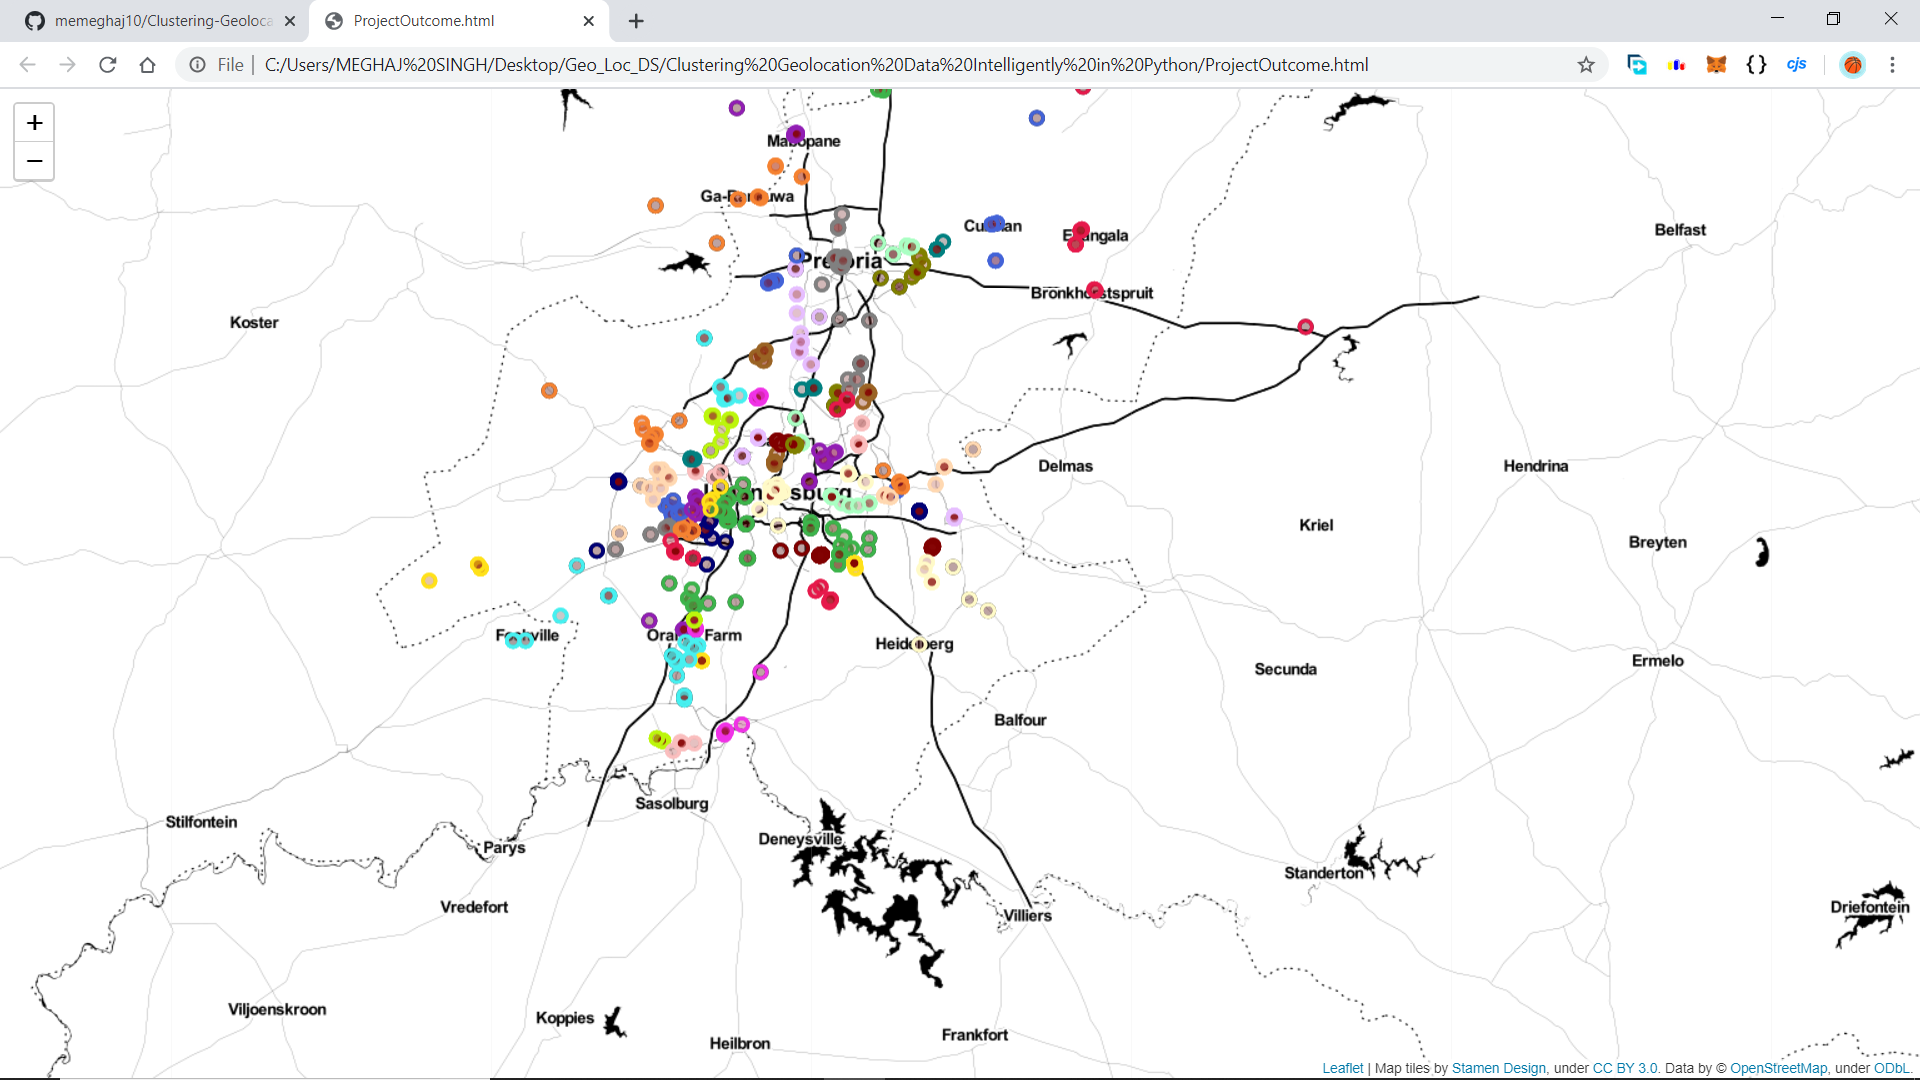
This is Coursera Guided Project completed by me with the following learning objectives:-
-
How to visualize and understand geographical data in an interactive way with Python.
-
How the K-Means algorithm works, and some of the shortcomings it has.
-
Density-based clustering approaches, and how to deal with any outliers they may classify.
Initially the project was completed by me on the Coursera's hands-on platform "Rhyme", but later I downloaded ht Jupyter Notebook and saved my progress.
Following python modules/functions have been used in the project:-
-
matplotlibfor plots and charts visualization of the outcomes. -
Pandasfor storing and manipulating data. -
Numpyfor its use in data-manipulation. -
hdbscanandDBSCANfor spatial-clusterings (hierarchichal). -
sklearnfunctionalities likeKmeansandsilhouette_scorewithKneighboursClassifier. -
foliumfor maps and co-ordinates visualization.
Task 1: An introduction to the problem, as well as basic exploratory data analysis and visualizations.
Task 2: Visualizing geographical data in a more meaningful and interactive way.
Task 3: Methods of evaluating the strength of a clustering algorithm.
Task 4: Theory behind K-Means, and how to use it for our problem.
Task 5: Introduction to density-based clustering approaches, and how to use DBSCAN.
Task 6: Introduction to HDBSCAN, to alleviate constraints of classical DBSCAN.
Task 7: A simple method to address outliers classified by density-based models.
At the end of this Project I found out that I need to work more on :-
-
K-MeansAlgorithm. -
Density-based clusteringapproaches withHDBSCAN. -
A little bit of
DataVisualizationskills.


