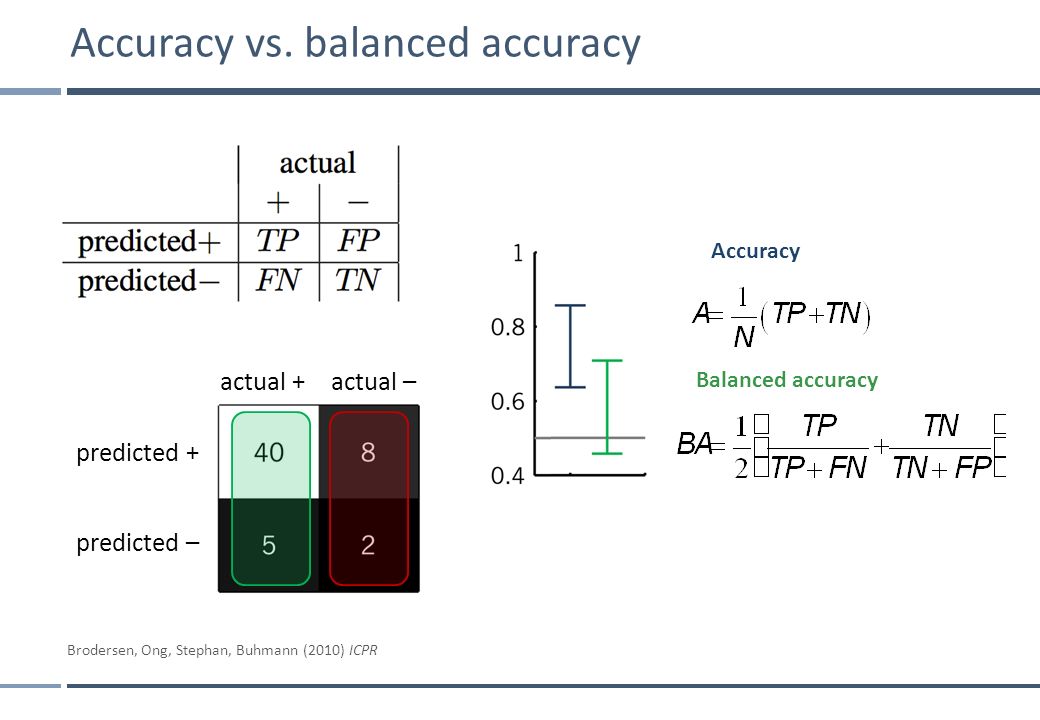
Accuracy is (true positives + true negatives)/(total population), precision is (true positives)/(true positives + false positives) and recall is (true positives)/(true positives + false negatives). Accuracy is not always perfect for model evaluation, especially for imbalanced data.
Balanced accuracy is calculated as the average of the proportion corrects of each class individually. It is important to consider this, rather than overall accuracy, in heavily imbalanced populations.
Precision focuses on false positive errors and recall focuses on false negative errors.
In the precision metric (actual positive/(actual positive + false positive)), all models get low marks for precision in the high-risk category, but this is okay. Actually the system is very good when considered in light of its business objective. This is because the system is designed to prioritize better recall vs. precision. Another way of describing this is to say the system is deliberately overly inclusive, i.e. statistically errs on the side of classifying a high-risk loan application as bad even if it might, in fact, be good.
Recall or sensitivity measures the proportion of actual positives that are correctly measured as such and F1 is a measure of a test's accuracy, considering both the precision and the recall (the harmonic mean of the two). High recall is more important than high precision in our study. Sensitivity/recall is the extent to which actual positives are not overlooked. It quantifies the avoidance of false negatives.
Specificity measures the proportion of actual negatives that are correctly identified as such. A highly specific test rarely registers a positive for anything that is not the target of testing. This metric quantifies the avoidance of false positives.
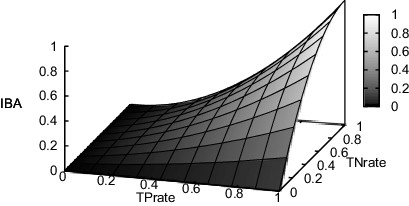
G-mean (geo) is the squared root of the product of the sensitivity and specificity. The best value is 1 and the worst value is 0. The Index of Balanced Accuracy (iba) combines an unbiased index of the overall accuracy and a measure about how dominant is the class with the highest individual accuracy rate.
Most of the models studies in this Challenge produce similar results across the various metrics. The recall using the RandomForest algorithm (for the high-risk category) is lower than the other models and cause for concern. This model does provide, though, for a prioritized ranking of features that should be considered in the loan application process and is very helpful in this regard. Here are the top ten features, ranked.
Based on the table of results below, the EasyEnsemble algorithm produced the best results on our dataset.
"Ensemble methods are techniques that aim at improving the accuracy of results in models by combining multiple models instead of using a single model. The combined models increase the accuracy of the results significantly. This has boosted the popularity of ensemble methods in machine learning." (What are Ensemble Methods?, CFI Education)
A metric not covered in our module is area under the curve (AUC), which is a "standard measure of accuracy for assessing the performance of credit scoring models. plots the relationship between true positives and true negatives. A true positive in credit risk assessment is a measure of how many creditworthy applicants are correctly identified as creditworthy. Whereas, true negative is a measure of how many uncreditworthy applications are identified as uncreditworthy. A good model will result in a high number of true positives and true negatives. The higher the AUC, the better the model is at assessing creditworthiness. " (The Impact of AUC and Gini on Credit Risk Models,Aleksandra Khokhlova ). I have calculated the AUC for both the Easy Ensemble and Random Forest data and the Easy Ensemble model performs much better on our data (.964 vs .848)
Based on the metrics covered in Module 17 plus the additional AUC evaluator, the Easy Ensemble model clearly produces the best results with our dataset.


