OpenVisualizer (OV) is part of UC Berkeley's OpenWSN project. It provides monitoring, visualization and simulation of OpenWSN-based wireless sensor network. See the project home page for more information. The project works in tandem with the OpenWSN firmware hosted at openwsn-fw. OpenVisualizer interfaces with locally connected hardware, the OpenTestBed infrastructure, IoT-LAB or an emulated OpenWSN network.
OpenVisualizer is distributed through PyPi. The only thing you need is a working Python 2.7 installation and pip. We recommend installing OpenVisualizer in a virtual environment. It makes it easier to manage multiple Python projects which require different Python versions and if something goes wrong you can simply delete the virtual environment without affecting your OS.
Install the virtualenv package, in case you do not already have it:
$ pip install virtualenvCreate a virtual environment (the name can be anything, here we use the name venv):
$ python -m virtualenv <NAME_OF_YOUR_VIRTUAL_ENV>Once installed you need to activate the virtual environment. On Linux or OSX:
$ source venv/bin/activateOn Windows (instructions have been tested for Windows CMD only):
$ .\venv\Scripts\activateOnce you have your virtual environment set up you can simply install OpenVisualizer as follows:
(venv) $ pip install openvisualizerPip will download and install all the dependencies.
On Windows the instructions are:
(venv) $ pip install openvisualizerAfter installing OpenVisualizer you need to remove the package pyreadline. The latter is a dependency of the coloredlogs package which is used to enabled colored logging output in OpenVisualizer. However, the pyreadline package is outdated and buggy on Windows 10. To prevent issues, you should remove it, the log coloring will still work without pyreadline installed.
(venv) $ pip uninstall pyreadlineIf you wish to develop for OpenVisualizer or mess around with the code, you should follow these steps:
- Setup a virtual environment (as described above) and activate the environment
- Clone the repository
(venv) $ git clone git@github.com:openwsn-berkeley/openvisualizer.git- Checkout the appropriate branch
- Move to the root of the git repository and install the tools
(venv) $ pip install -e .The last command will locally install the Python package in an editable form. If you change your Python code the package will automatically use your new code.
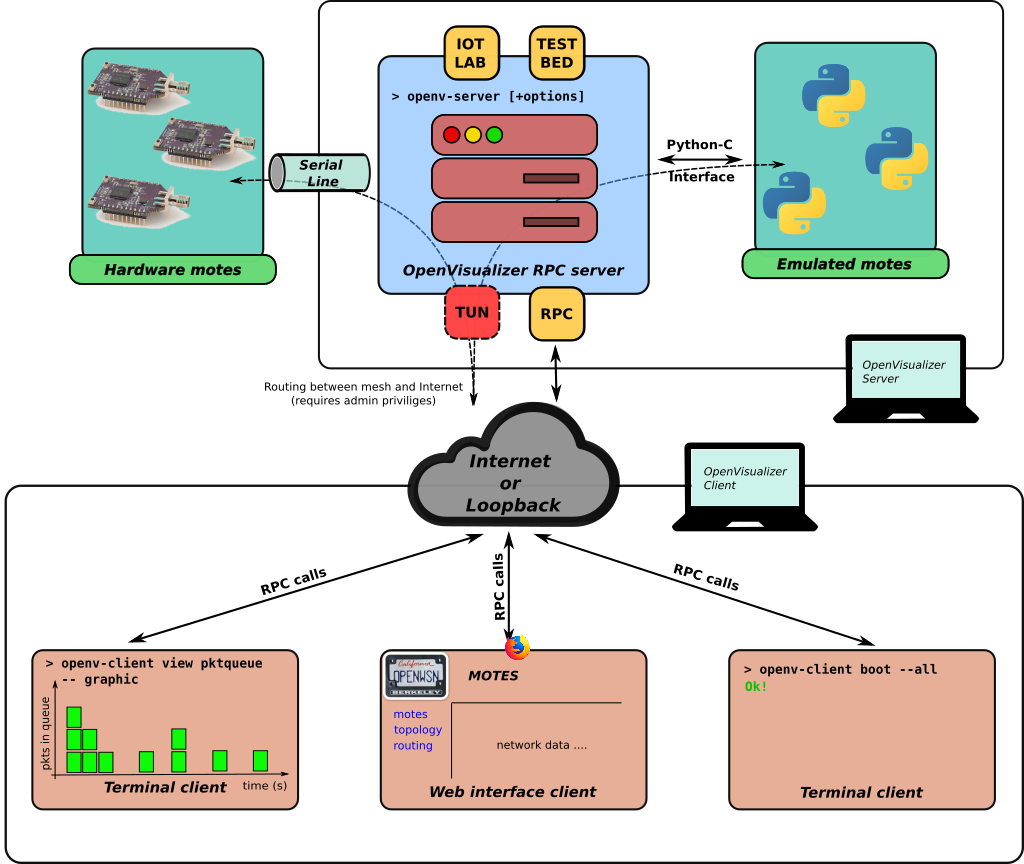
The architecture of OpenVisualizer is split into two main components:
- OpenVisualizer Server
- OpenVisualizer Client
The OpenVisualizer Server contains all the code to interface with a mesh network consisting of motes running the OpenWSN firmware. The server can interact with locally connected hardware or with a networks deployed on IoT-LAB or the OpenTestBed. Alternatively, the server can simulate a network and run the firmware code on emulated motes, locally on your computer. To achieve mote emulation, the OpenWSN firmware is compiled as a Python C extension. Mote emulation is particularly useful when you don't have hardware at hand or for debugging purposes. Inside the openvisualizer Python package there are several subpackages. All of the subpackages, with exception of the package called client, implement different parts of the OpenVisualizer Server. Some important features are:
- motehandler: interfaces directly with the motes and the network. It allows other components of the OpenVisualizer Server and the OpenVisualizer Clients to communicate with the individual motes. In parallel, the
motehandlerpackage maintains important status information about each mote in the network and provides parsing of the network and mote logging output. - jrc: provides an implementation of the "Join Request Proxy". The JRC plays an important role when nodes want to join an existing network securely.
- rpl: implements RPL source routing for the mesh and provides the user with network topology information.
- opentun & openlbr: are packages that parse network traffic between the mesh and the Internet. The
opentunpackage specifically allows OpenVisualizer to route network traffic between the Internet and the mesh.
The OpenVisualizer Server also serves as a remote procedure call (RPC) server. It exposes a set of methods that are used by OpenVisualizer Clients to inspect, monitor and manipulate the network or individual motes.
There are two types of clients: the terminal client and the web interface client. Both clients are started with the same command and connect to the OpenVisualizer Server. They subsequently use RPC calls to interact with the network and the motes. They query the server for network and mote status information and display the results either directly in the terminal or through the web interface.
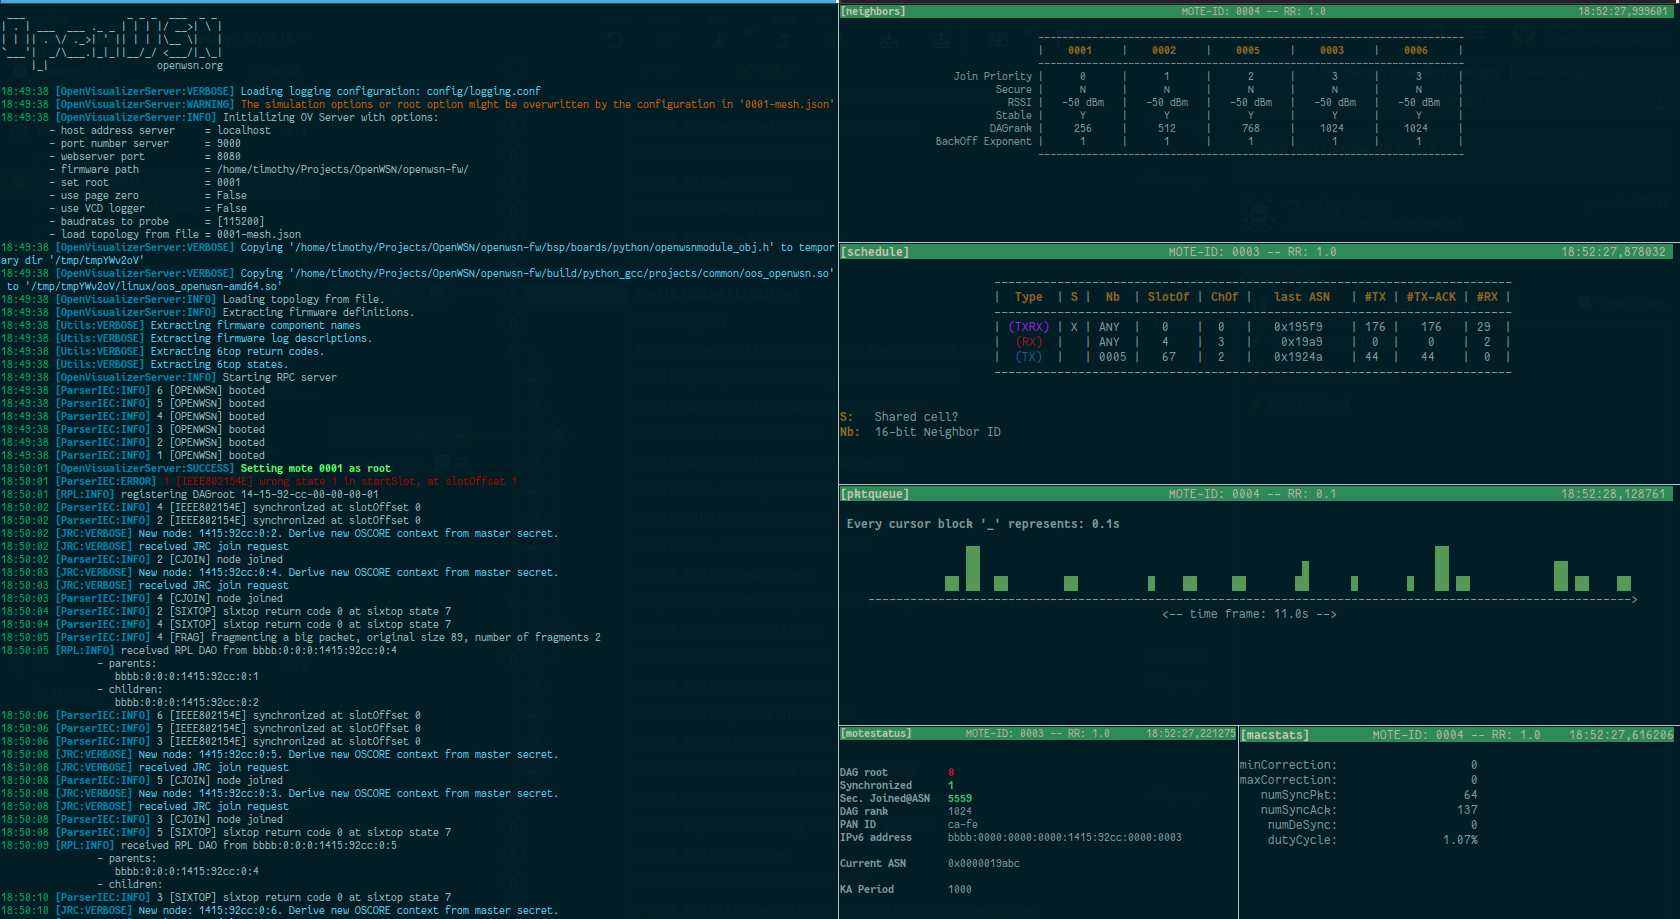
The image below shows an instance of OpenVisualizer Server (on the left), and five connected OpenVisualizer Clients (on the right). Each client displays information about a specific mote, i.e., the neighbor table, the TSCH schedule, the packet queue pressure, general mote information, and MAC-layer statistics.
OpenVisualizer depends on the firmware code hosted in the openwsn-fw repository. Before you can run OpenVisualizer you should clone you the openwsn-fw and define an environment variable called OPENWSN_FW_BASE which points to the root of your local openwsn-fw directory.
$ git clone git@github.com:openwsn-berkeley/openwsn-fw.git
$ export OPENWSN_FW_BASE=<PATH_TO_OPENWSN-FW>
Alternatively you could use the --fw-path option when you launch the OpenVisualizer Server.
There are two basic commands:
- openv-server
- openv-client
openv-server
The openv-server command starts the OpenVisualizer Server. Depending on the provide options it will:
- Scan the local serial ports (
/dev/tty*on Unix orCOM*on Windows) for connected hardware, see hardware - Launch an emulated mesh network, see simulation
- Connect to IoT-LAB, see iotlab
- Use Inria's OpenTestBed, see opentestbed
All the available options can be listed with the following command:
(venv) $ openv-server --helpopenv-client
The openv-client command can change the parameters of the network and the server of display information. It takes several options and subcommands. More information can be displayed as follows:
(venv) $ openv-client --helpMost openv-client commands will issue a single call to the OpenVisualizer Server and exit immediately. For example the following command sets the mote with identifier AF8B, as the DAG root of the network.
(venv) $ openv-client root AF8BOther useful commands are:
- boot: only available when the server is running a simulated network and when the emulated motes have not yet booted. By default the server will immediately boot the emulated motes, but you can change this behavior by adding the
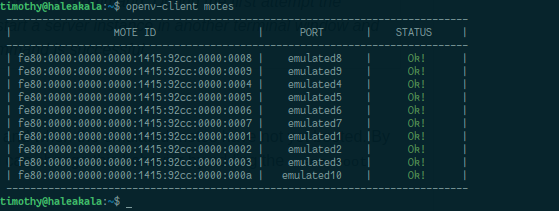
--no-bootoption. - motes: lists the addresses of the connected motes
 |
|---|
| The addresses of the emulated motes before the network was formed and after network formation. |
- shutdown: kills the server
The final subcommand of the openv-client is called view. It can display several types of mote or network status information. You can list the different views as follows:
(venv) $ openv-client view --helpEach view command works in the same way. It starts a thread that periodically queries the server for a specific bit of information for a specified mote. It then displays this information nicely by using the Python package blessed, a wrapper around the Pythoncurses module, or through the web browser (when you use the view called web). The option --refresh-rate=<x> (not available for the web view) can change how often the view is updated, i.e., queries the OpenVisualizer Server (default is 1s).
 |
|---|
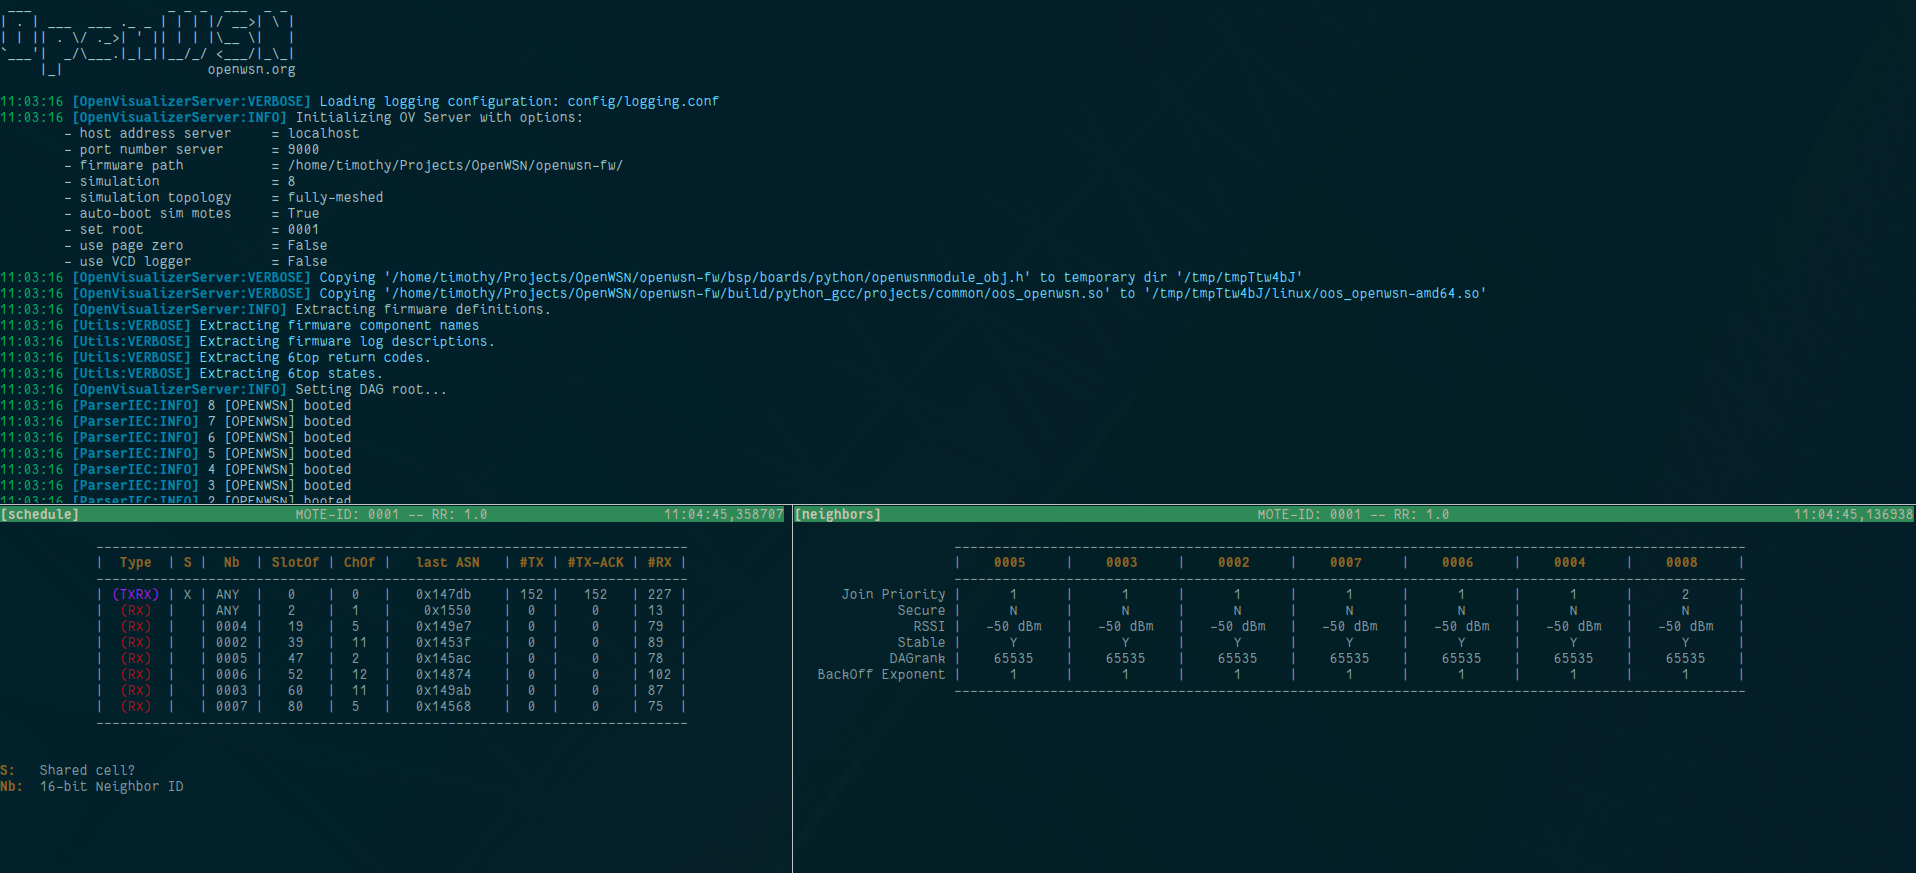
| The top terminal panel shows the output of the OpenVisualizer Server. On the bottom there are two active views, schedule and neighbors, each in there own terminal panel |
In the bottom-left terminal panel:
(venv) $ openv-client view schedule 0001In the bottom-right terminal panel:
(venv) $ openv-client view neigbors 0001The web view can be started as follows:
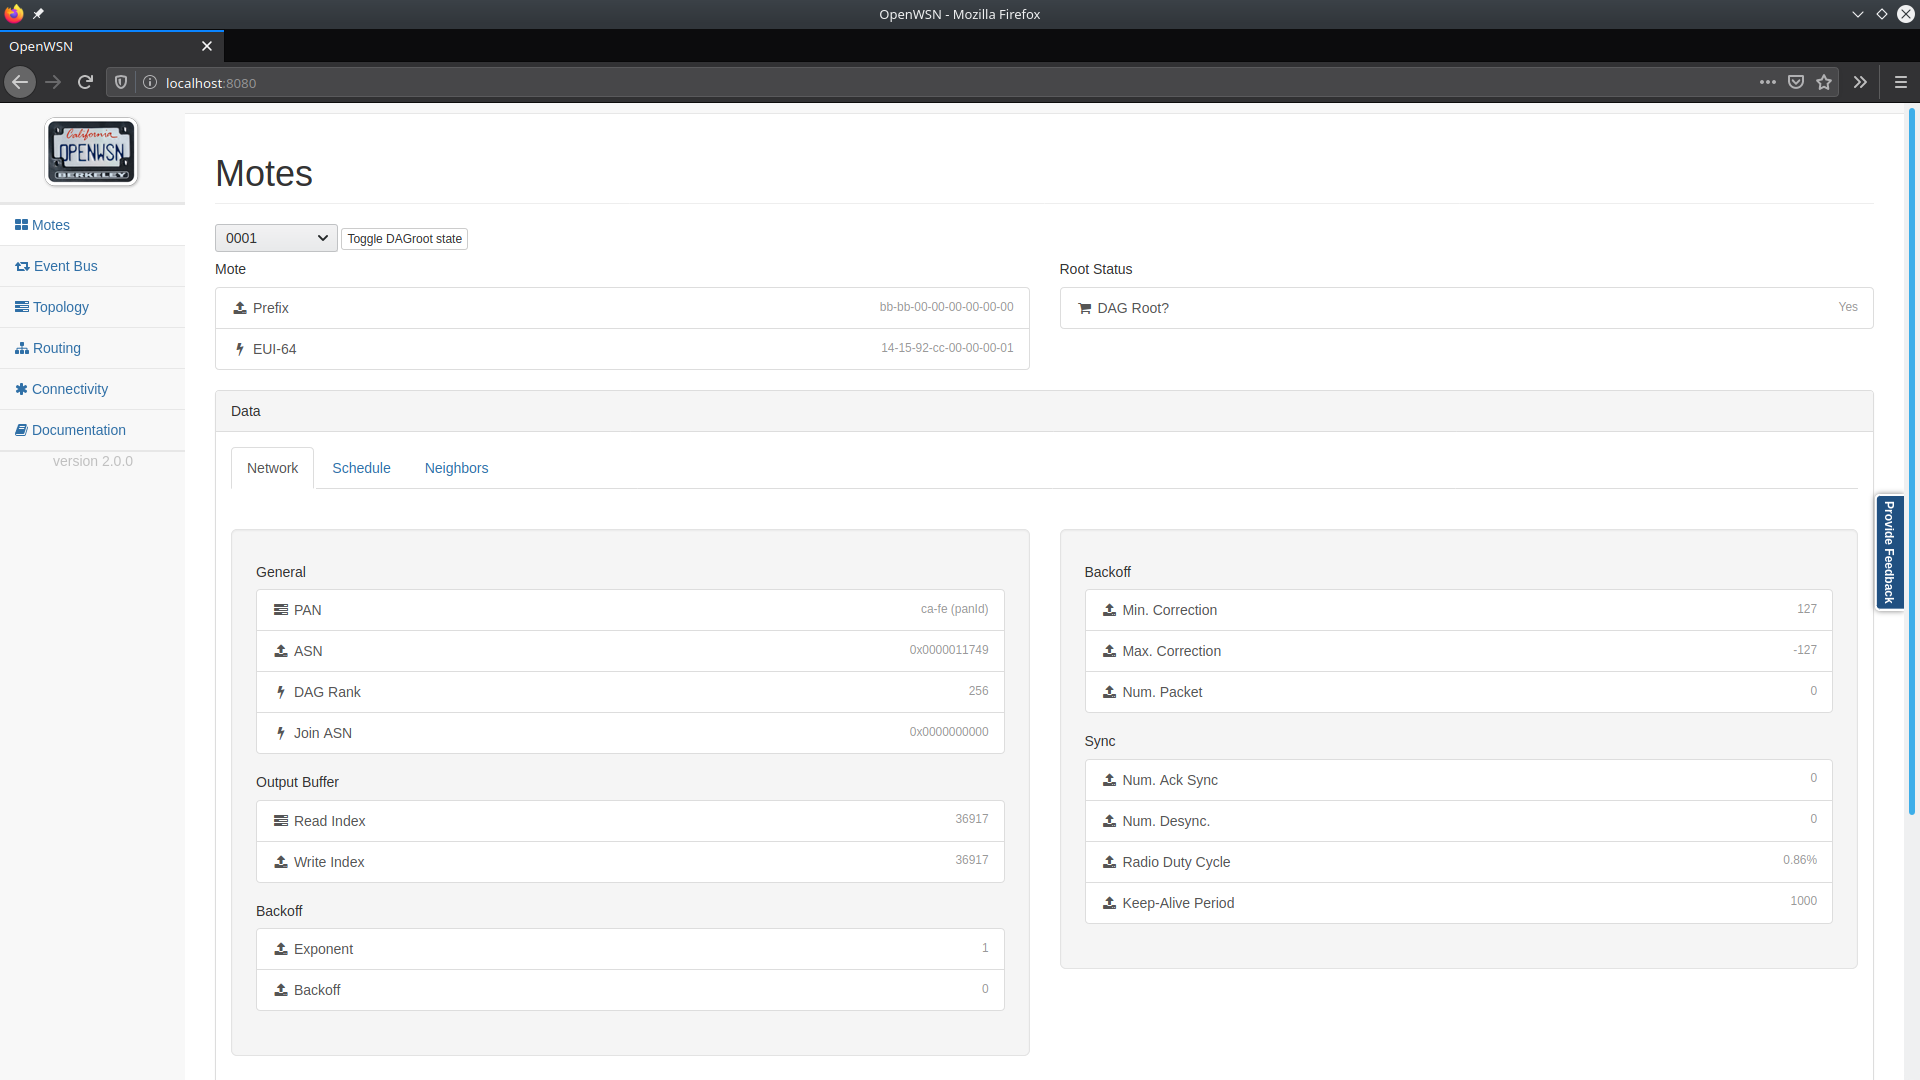
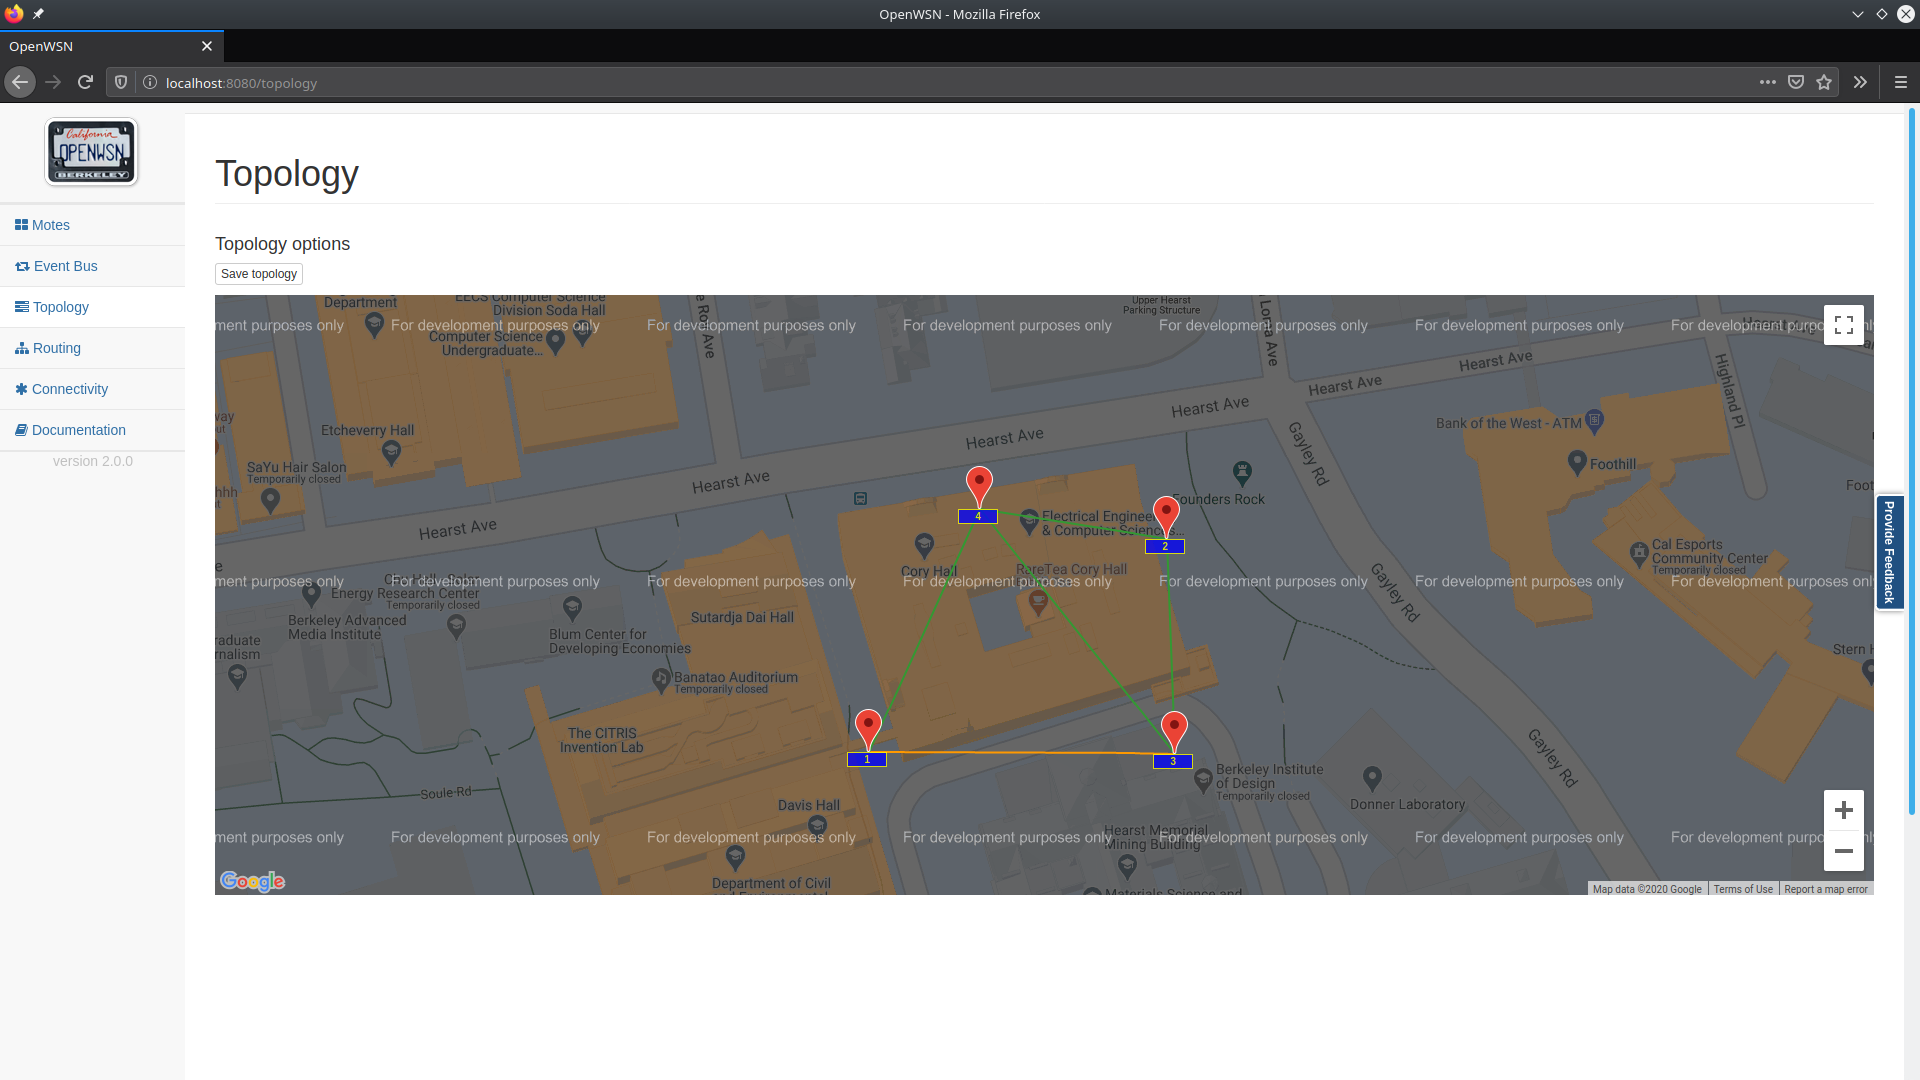
(venv) $ openv-client view web| Web view (main tab) | Web view (topology tab) |
|---|---|
 |
 |
- A valid IoT-LAB account
- A set of flashed nodes. You can flash IoT-LAB directly on the web interface or through their CLI tools. (refer to IoT-LAB documentation for this)
Its possible to connect the OpenVisualizer Server with the IoT-LAB infrastructure. A depiction of how the connection is set up can be found below.
 |
|---|
| IoT-LAB connections |
When OpenVisualizer is not running on the SSH frontend (see figure above) a ssh-tunnel is opened to connect to the IoT-LAB motes' TCP port.
You can specify the motes to connect to by using the --iotlab-motes option, it receives a list of IoT-LAB motes'network_addresses (e.g., m3-4.grenoble.iot-lab.info).
When OpenVisualizer Server runs directly on the SSH frontend you can use the short address notation, e.g., m3-4.
-
SSH frontend:
(venv) $ openv-server --iotlab-motes m3-4 m3-5.
-
Locally:
(venv) $ openv-server --iotlab-motes m3-4.grenoble.iot-lab.info m3-5.grenoble.iot-lab.info
You can authenticate to IoT-LAB upfront by running:
(venv) $ iotlab-auth -u <login>Otherwise you need to pass your username and password as additional parameters:
(venv) $ openv-server --iotlab-motes m3-10 m3-11 --user <USERNAME> --password <PASSWORD>Running the OpenVisualizer Server as a frontend for the OpenTestBed is as simple as:
(venv) $ openv-server --opentestbedThe server connects in the background to the MQTT server that gathers the data from the testbed and subscribes to the appropriate topics.
The docs can be generated through Sphinx. Navigate to the root of the project and run the following the command:
(venv) $ sphinx-build -b html docs build- docs is the source directory
- build will contain the output
More information can be found on the Sphinx webpage
The OpenWSN firmware uses the serial port extensively to communicate with OpenVisualizer and route packets (when in DAGroot mode). It is thus important that serial communication works well. To verify the serial communication between the hardware motes and your computer you can use the openv-serial tool.
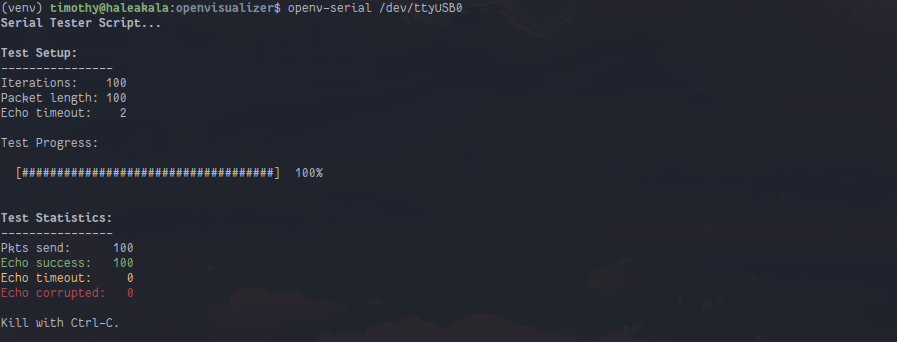 |
|---|
| openv-serial tool for testing the serial communication |
To route packets between the Internet and the OpenWSN mesh network, OpenVisualizer uses a TUN interface. To create such an interface you need root privileges on your system. To test if everything works properly, you can run openv-tun.
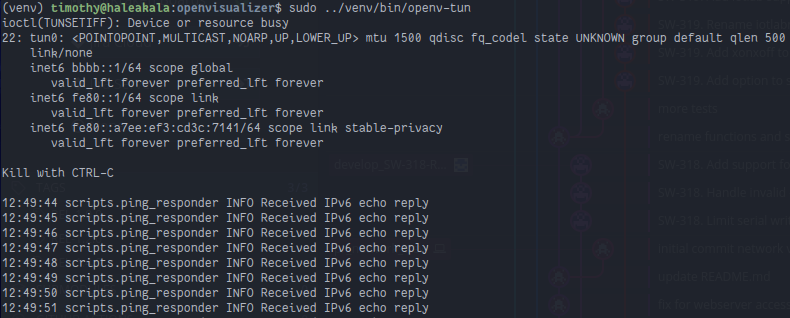 |
|---|
| openv-tun tool for testing the TUN interface |
Contributions are always welcome. We use flake8 to enforce the Python PEP-8 style guide. The Travis builder verifies new pull requests and it fails if the Python code does not follow the style guide.
You can check locally if your code changes comply with PEP-8. First, install the main flake8 package and two flake8 plugins:
(venv) pip install flake8
(venv) pip install pep8-naming
(venv) pip install flake8-commas
Move to the root of the OpenVisualizer project and run:
(venv) flake8 --config=tox.iniIf flake does not generate any output, your code passes the test; alternatively, you can check the return code:
(venv) flake8 --config=tox.ini
(venv) echo $?
0
